SPM 07-11-2020: Hot Day Statewide

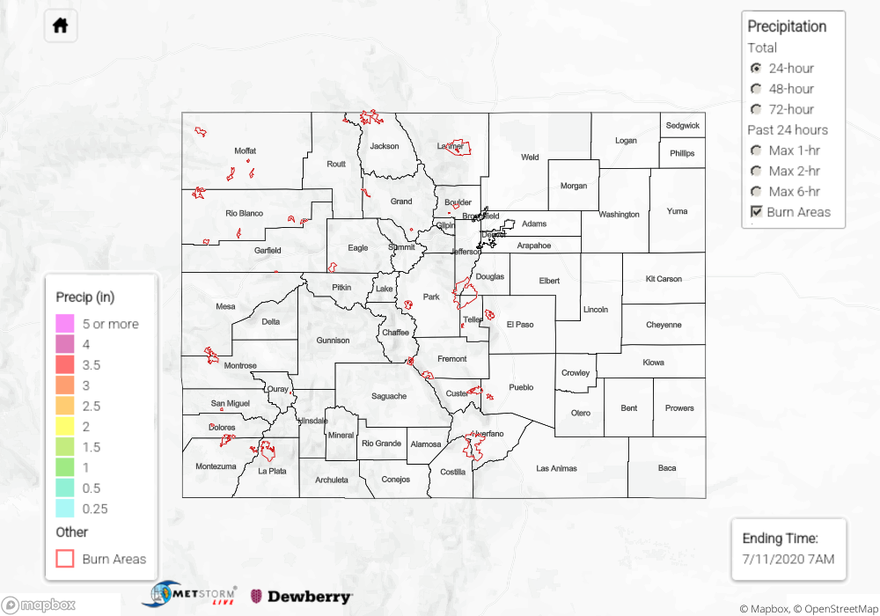
Issue Date: Saturday, July 11th, 2020
Issue Time: 9:45AM MDT

Summary:

It really heated up yesterday, which isn’t surprising looking at the strength of the ridge. Over western Colorado in the Grand Valley, Delta hit 102F with high 90Fs elsewhere. Grand Junction was just shy of the 100F mark, and Durango hit 91F. Most mountain valleys were in the 80Fs, and Leadville hit 79F at 10.1K ft. Over eastern Colorado highs were 100F (or slightly more) in Fort Collins, Denver, and Pueblo. The Springs hit 92F and Fort Morgan topped out at 102F. All in all, it was a scorcher. Dew points were in the 60Fs over the eastern plains with highs in the upper 90Fs, but a cap in place and no lifting mechanism kept storms from forming. A weak storm attempted to pop over the northeast corner of the state around 6PM, but quickly dissipated. So other than some minor rainfall in the core, it remained dry.

Here’s a quick (mountain) fire update. They YMCA fire that started near Canyon City on Wednesday is now 40% contained and has burned about 300 acres. The Goose Creek fire in Mineral County has burned 170 acres and is 75% contained. Lastly, the San Creek Fire (border of Hinsdale and Archuleta County) is 20% contained and has burned ~100 acres.

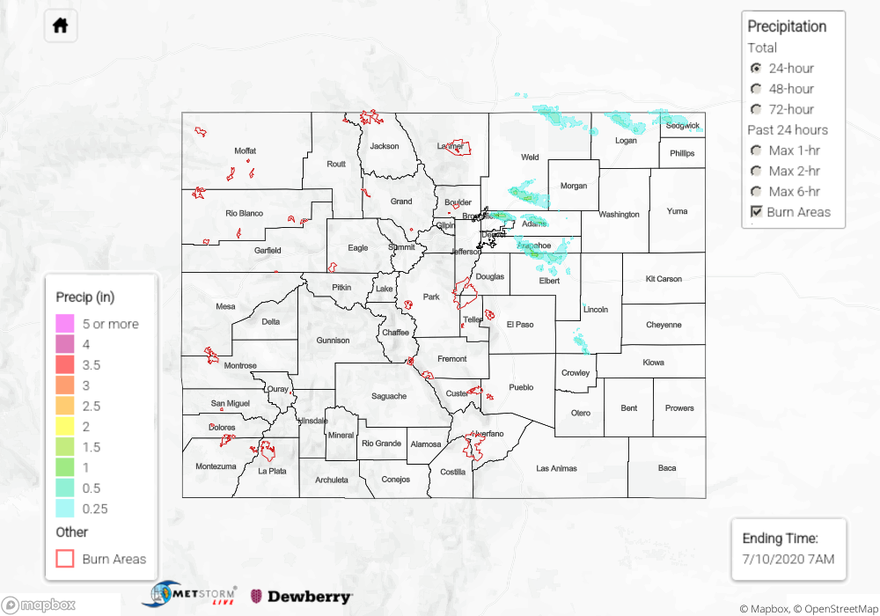
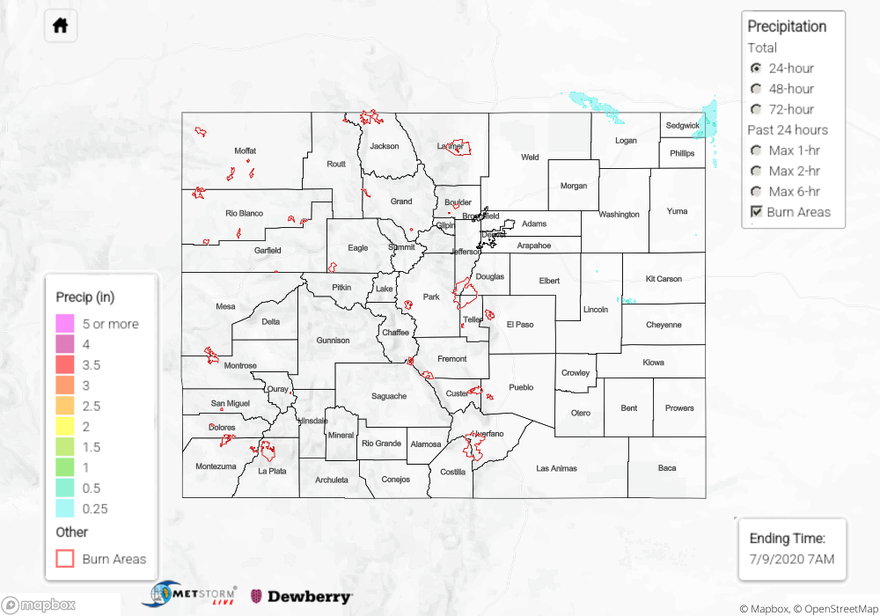
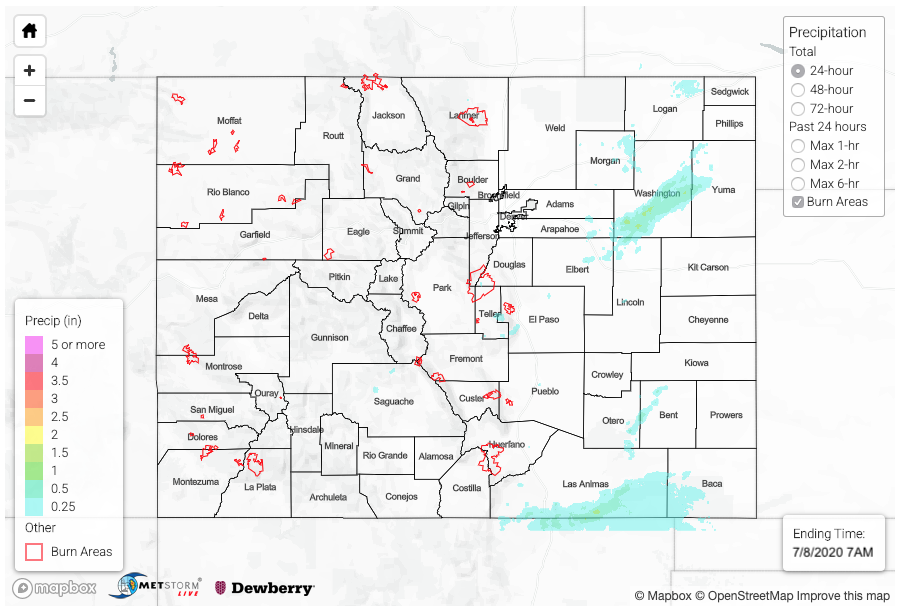
To see precipitation estimates in your area over the last 48 to 72-hours, scroll down to the State Precipitation Map below.

Click Here For Map Overview

The map below shows radar-estimated, rainfall gage-adjusted Quantitative Precipitation Estimates (QPE) across Colorado. The map is updated daily during the operational season (May 1 – Sep 30) by 11AM. The following six layers are currently available: 24-hour, 48-hour and 72-hour total precipitation, as well as maximum 1-hour, 2-hour and 6-hour precipitation over the past 24 hour period (to estimate where flash flooding may have occurred). The 24-hour, 48-hour and 72-hour total precipitation contain bias corrections that are not disaggregated into the hourly estimates, so there will likely be some differences. The accumulation ending time is 7AM of the date shown in the bottom right corner. Also shown optionally are vulnerable fire burn areas (post 2012), which are updated throughout the season to include new, vulnerable burn areas. The home button in the top left corner resets the map to the original zoom.

SPM 07-10-2020: Evening Storms Produce Hail and Rain Across Arapahoe and Adam Counties

Issue Date: Friday, July 10th, 2020
Issue Time: 11AM MDT

Summary:

An overnight outflow boundary moved into eastern Colorado Wednesday night, which returned a large amount of low-level moisture to the Northeast Plains. It was quite muggy over the eastern plains yesterday with dew points reaching around 60F (border counties)! There was capping aloft, so afternoon storms weren’t widespread over the eastern plains, and took a while to pop. However, outflow boundaries from the initial storms (6PM) help trigger additional storms back west that lasted through about 3AM. Storm cores were relatively small, but several Severe Thunderstorm Warnings were issued. Storms around the metro area (Adams and Arapahoe Counties) produced hail from 1 inch to 2.5 inch in diameter. They also produced 60 mph wind gusts near Brighton, CO, which caused some broken branches and flying debris. As far as rainfall, the QPE likely has a little hail contamination today, which will inflate the totals. A CoCoRaHS station near Strasburg recorded 0.80 inches for the 24-hour period, and an ALERT gage at DIA recorded 0.39 inches. There was a gage near Todd Creek that recorded 1.27 inches, but no other gages around this high of total. It is likely this is contaminated. All in all, there were some powerful little storms. Flooding was not reported as of this morning.

For precipitation estimates in your neighborhood over the last 24 to 72-hours, scroll down to the State Precipitation Map below.

Click Here For Map Overview

The map below shows radar-estimated, rainfall gage-adjusted Quantitative Precipitation Estimates (QPE) across Colorado. The map is updated daily during the operational season (May 1 – Sep 30) by 11AM. The following six layers are currently available: 24-hour, 48-hour and 72-hour total precipitation, as well as maximum 1-hour, 2-hour and 6-hour precipitation over the past 24 hour period (to estimate where flash flooding may have occurred). The 24-hour, 48-hour and 72-hour total precipitation contain bias corrections that are not disaggregated into the hourly estimates, so there will likely be some differences. The accumulation ending time is 7AM of the date shown in the bottom right corner. Also shown optionally are vulnerable fire burn areas (post 2012), which are updated throughout the season to include new, vulnerable burn areas. The home button in the top left corner resets the map to the original zoom.

SPM 07-09-2020: A (Mainly) Dry Heat Continued

Issue Date: Thursday, July 9th, 2020
Issue Time: 10:50AM MDT

Summary:

Wednesday was one of the driest days of the past week or so with a ridge of high pressure exerting dominance over most of the state. Nonetheless, a small pocket of northeast Colorado still experienced some very interesting weather. A few storms held intact as they moved southeast off the Cheyenne Ridge in Wyoming. Though moisture was meager, it was enough to fuel the storms for several hours, which along with the adequate wind shear resulted in severe weather. Things began with a wind gust to 70 mph over the eastern Pawnee Grasslands. The storms then produced some hail with a report of 0.75 inches in Logan County. The storms were able to consolidate their inflow enough to produce a handful of tornado reports in Phillips and Sedgwick counties. One report even noted that up to three tornadoes were seen at once, though fortunately they were the relatively less dangerous “landspout” type. Rainfall was very limited due to the dry sub-cloud layer though perhaps up to 0.5 inches fell across parts of Sedgwick County. The highest observed amount was only a few hundredths of an inch.

Outside of the small area described above, everyone else experience another very hot day. Temperatures were up to 10F above normal, mainly east of the Continental Divide. Pueblo reached a high temperature of 104F, which was probably the most anomalous value on Wednesday, relative to average.

Flooding was not reported on Wednesday. For precipitation estimates in your neighborhood over the last 24 to 72-hours, scroll down to the State Precipitation Map below.

Click Here For Map Overview

The map below shows radar-estimated, rainfall gage-adjusted Quantitative Precipitation Estimates (QPE) across Colorado. The map is updated daily during the operational season (May 1 – Sep 30) by 11AM. The following six layers are currently available: 24-hour, 48-hour and 72-hour total precipitation, as well as maximum 1-hour, 2-hour and 6-hour precipitation over the past 24 hour period (to estimate where flash flooding may have occurred). The 24-hour, 48-hour and 72-hour total precipitation contain bias corrections that are not disaggregated into the hourly estimates, so there will likely be some differences. The accumulation ending time is 7AM of the date shown in the bottom right corner. Also shown optionally are vulnerable fire burn areas (post 2012), which are updated throughout the season to include new, vulnerable burn areas. The home button in the top left corner resets the map to the original zoom.

SPM 07-08-2020: Weak T-Storms for Eastern and Southern Colorado with Hot Temperatures Statewide

Issue Date: Wednesday, July 8th, 2020
Issue Time: 9AM MDT

Summary:

It was toasty yesterday, and both Grand Junction and Denver hit 99F. It was 90F just after 10AM for both locations, so not too surprising that it got that hot. Highest temperature from NWS ASOS stations was in Greeley (102F), and there were a couple other stations over the Northeast Plains that reached 101F. Coverage of these stations isn’t great over the eastern plains, so there were likely local, hotter temperatures over the region. Not much moisture over western Colorado, the mountains, and Urban Corridor, so only elevated convection occurred back west. A passing shortwave helped carry the convection into the eastern plains. Slightly better low-level moisture allowed storms to intensify and drop some light to moderate rain. The highest rainfall totals were over Washington and Las Animas Counties. Of course there were no gages in these remote areas, so it’s hard to verify the QPE below. Based on the last week or so, I’d guess the rainfall was estimated a little high in the core of the storms. That’s due to the dry surface layer and high bases promoting evaporation as the drops fell. My best guess is totals were closer to 0.50 inches. The storm complex over the Northeast Plains also produced some 60 mph wind gusts in Yuma, Adams, and Phillips Counties. There was no damage reported as of this morning. I could only find one new fire report, which was just north of Meeker (Axial, CO). So far the fire has burned 25 acres, and is not occurring over steep terrain.

For precipitation estimates in your neighborhood over the last 24 to 72-hours, scroll down to the State Precipitation Map below.

Click Here For Map Overview

The map below shows radar-estimated, rainfall gage-adjusted Quantitative Precipitation Estimates (QPE) across Colorado. The map is updated daily during the operational season (May 1 – Sep 30) by 11AM. The following six layers are currently available: 24-hour, 48-hour and 72-hour total precipitation, as well as maximum 1-hour, 2-hour and 6-hour precipitation over the past 24 hour period (to estimate where flash flooding may have occurred). The 24-hour, 48-hour and 72-hour total precipitation contain bias corrections that are not disaggregated into the hourly estimates, so there will likely be some differences. The accumulation ending time is 7AM of the date shown in the bottom right corner. Also shown optionally are vulnerable fire burn areas (post 2012), which are updated throughout the season to include new, vulnerable burn areas. The home button in the top left corner resets the map to the original zoom.