Issue Date: Saturday, July 11th, 2020
Issue Time: 9:45AM MDT
Summary:
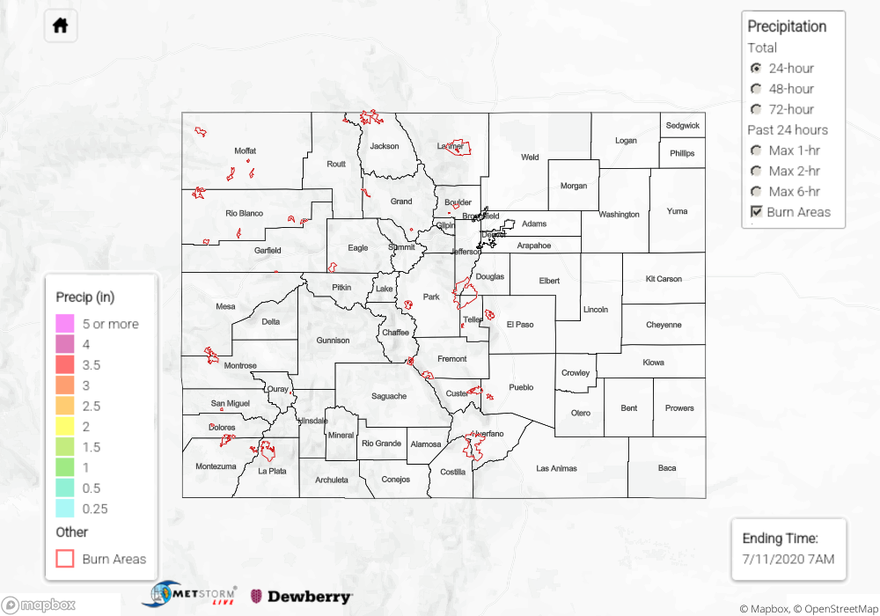
It really heated up yesterday, which isn’t surprising looking at the strength of the ridge. Over western Colorado in the Grand Valley, Delta hit 102F with high 90Fs elsewhere. Grand Junction was just shy of the 100F mark, and Durango hit 91F. Most mountain valleys were in the 80Fs, and Leadville hit 79F at 10.1K ft. Over eastern Colorado highs were 100F (or slightly more) in Fort Collins, Denver, and Pueblo. The Springs hit 92F and Fort Morgan topped out at 102F. All in all, it was a scorcher. Dew points were in the 60Fs over the eastern plains with highs in the upper 90Fs, but a cap in place and no lifting mechanism kept storms from forming. A weak storm attempted to pop over the northeast corner of the state around 6PM, but quickly dissipated. So other than some minor rainfall in the core, it remained dry.
Here’s a quick (mountain) fire update. They YMCA fire that started near Canyon City on Wednesday is now 40% contained and has burned about 300 acres. The Goose Creek fire in Mineral County has burned 170 acres and is 75% contained. Lastly, the San Creek Fire (border of Hinsdale and Archuleta County) is 20% contained and has burned ~100 acres.
To see precipitation estimates in your area over the last 48 to 72-hours, scroll down to the State Precipitation Map below.
Click Here For Map Overview
