Issue Date: Wednesday, July 8th, 2020
Issue Time: 9AM MDT
Summary:
It was toasty yesterday, and both Grand Junction and Denver hit 99F. It was 90F just after 10AM for both locations, so not too surprising that it got that hot. Highest temperature from NWS ASOS stations was in Greeley (102F), and there were a couple other stations over the Northeast Plains that reached 101F. Coverage of these stations isn’t great over the eastern plains, so there were likely local, hotter temperatures over the region. Not much moisture over western Colorado, the mountains, and Urban Corridor, so only elevated convection occurred back west. A passing shortwave helped carry the convection into the eastern plains. Slightly better low-level moisture allowed storms to intensify and drop some light to moderate rain. The highest rainfall totals were over Washington and Las Animas Counties. Of course there were no gages in these remote areas, so it’s hard to verify the QPE below. Based on the last week or so, I’d guess the rainfall was estimated a little high in the core of the storms. That’s due to the dry surface layer and high bases promoting evaporation as the drops fell. My best guess is totals were closer to 0.50 inches. The storm complex over the Northeast Plains also produced some 60 mph wind gusts in Yuma, Adams, and Phillips Counties. There was no damage reported as of this morning. I could only find one new fire report, which was just north of Meeker (Axial, CO). So far the fire has burned 25 acres, and is not occurring over steep terrain.
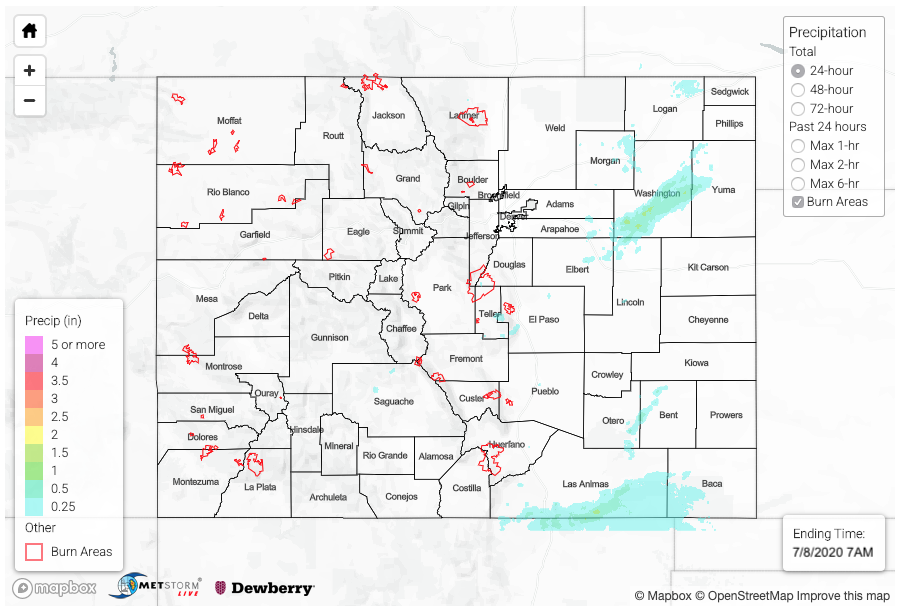
For precipitation estimates in your neighborhood over the last 24 to 72-hours, scroll down to the State Precipitation Map below.
Click Here For Map Overview