Issue Date: Friday, July 10th, 2020
Issue Time: 11AM MDT
Summary:
An overnight outflow boundary moved into eastern Colorado Wednesday night, which returned a large amount of low-level moisture to the Northeast Plains. It was quite muggy over the eastern plains yesterday with dew points reaching around 60F (border counties)! There was capping aloft, so afternoon storms weren’t widespread over the eastern plains, and took a while to pop. However, outflow boundaries from the initial storms (6PM) help trigger additional storms back west that lasted through about 3AM. Storm cores were relatively small, but several Severe Thunderstorm Warnings were issued. Storms around the metro area (Adams and Arapahoe Counties) produced hail from 1 inch to 2.5 inch in diameter. They also produced 60 mph wind gusts near Brighton, CO, which caused some broken branches and flying debris. As far as rainfall, the QPE likely has a little hail contamination today, which will inflate the totals. A CoCoRaHS station near Strasburg recorded 0.80 inches for the 24-hour period, and an ALERT gage at DIA recorded 0.39 inches. There was a gage near Todd Creek that recorded 1.27 inches, but no other gages around this high of total. It is likely this is contaminated. All in all, there were some powerful little storms. Flooding was not reported as of this morning.
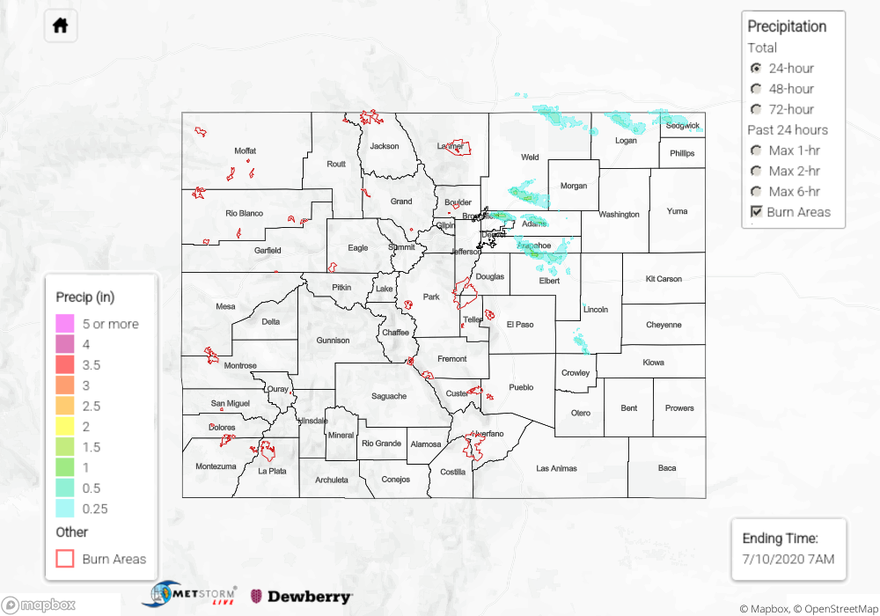
For precipitation estimates in your neighborhood over the last 24 to 72-hours, scroll down to the State Precipitation Map below.
Click Here For Map Overview