Issue Date: Thursday, July 9th, 2020
Issue Time: 10:50AM MDT
Summary:
Wednesday was one of the driest days of the past week or so with a ridge of high pressure exerting dominance over most of the state. Nonetheless, a small pocket of northeast Colorado still experienced some very interesting weather. A few storms held intact as they moved southeast off the Cheyenne Ridge in Wyoming. Though moisture was meager, it was enough to fuel the storms for several hours, which along with the adequate wind shear resulted in severe weather. Things began with a wind gust to 70 mph over the eastern Pawnee Grasslands. The storms then produced some hail with a report of 0.75 inches in Logan County. The storms were able to consolidate their inflow enough to produce a handful of tornado reports in Phillips and Sedgwick counties. One report even noted that up to three tornadoes were seen at once, though fortunately they were the relatively less dangerous “landspout” type. Rainfall was very limited due to the dry sub-cloud layer though perhaps up to 0.5 inches fell across parts of Sedgwick County. The highest observed amount was only a few hundredths of an inch.
Outside of the small area described above, everyone else experience another very hot day. Temperatures were up to 10F above normal, mainly east of the Continental Divide. Pueblo reached a high temperature of 104F, which was probably the most anomalous value on Wednesday, relative to average.
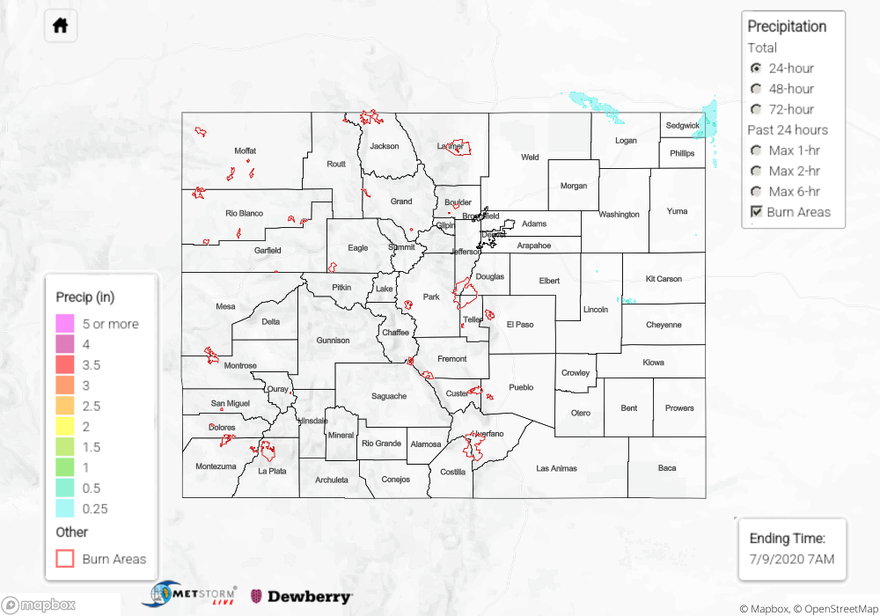
Flooding was not reported on Wednesday. For precipitation estimates in your neighborhood over the last 24 to 72-hours, scroll down to the State Precipitation Map below.
Click Here For Map Overview