SPM 08-16-2020: Severe Storms Drop Large Hail over Eastern Colorado & Flooding Reported over the Spring Creek Burn Area

Issue Date: Sunday, August 16th, 2020
Issue Time: 10:05AM MDT

Summary:

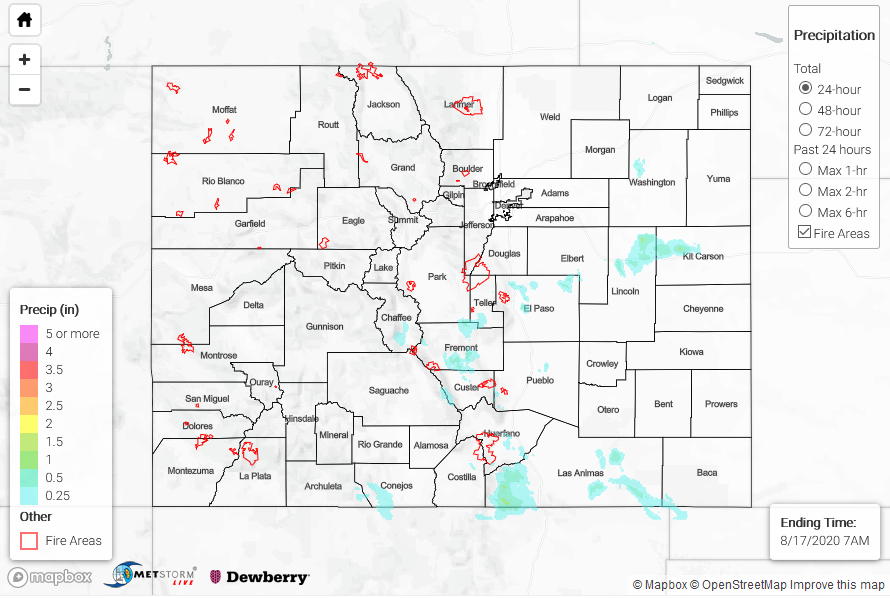
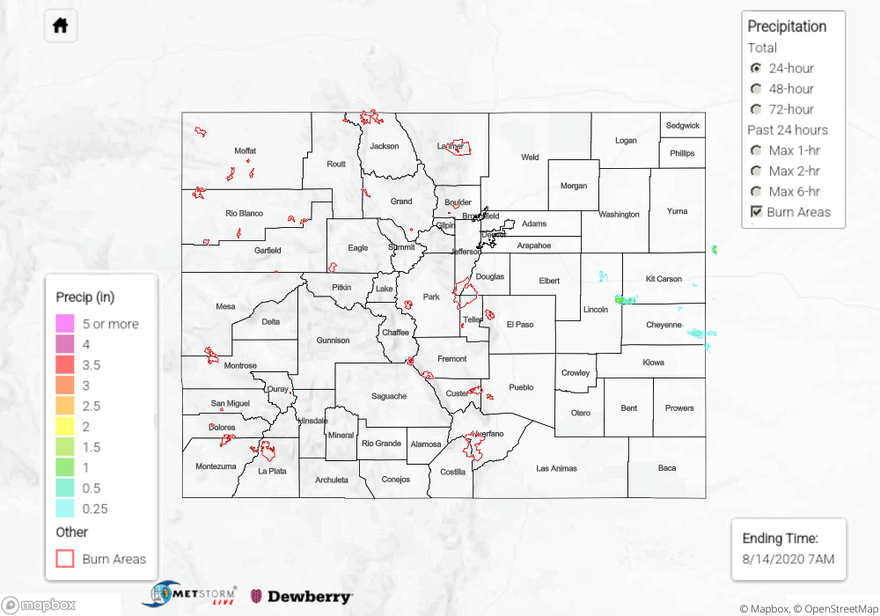
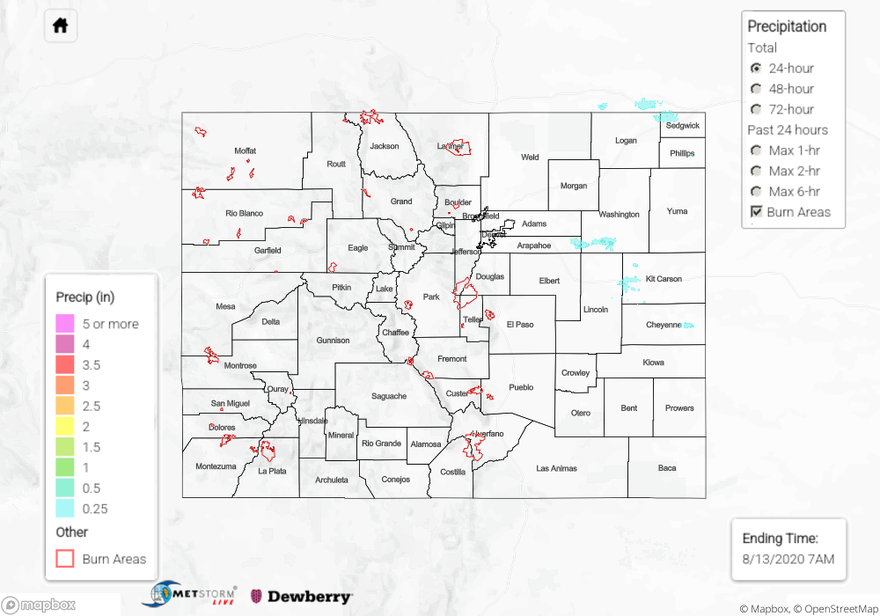
Upslope flow storms began to fire just after 1PM near the southern border with storms popping over the Palmer and Raton Ridge between 3:30 and 4PM. Storms that fired in Conejos County produce 24-hour totals around 0.45 inches. Over the Palmer Ridge, storms produce more hail than rain with reports of hail size near the Colorado Springs area ranging from 0.75 inch to 2 inches (Peterson AFB). Storm totals were just under 0.5 inches according to USGS and CoCoRaHS reports in the area. A complex of storms over Fremont County produced up to 0.75 inches. A storm tracked over the southern edge of the Spring Creek burn area around 3:30 PM, and mud flows and flash flooding were reported across Highway 12. This seems to be the most sensitive part of the burn area as a Weather Underground gauge recorded only 0.25 inches of rain. Extra convergence along the Raton Ridge and a couple rounds of storms help totals reach just over 1 inch.

Stronger storms developed over the eastern plains in the evening hours where better parameters existed for storms to become severe. They had trouble breaking the cap that was in place, but the storms that did form dropped some heavy rainfall and large hail. A storm in Washington County produce a weak tornado (landspout) that lasted 2 to 3 minutes just after 5:30PM. This same storm produced 2 inch hail (hen egg) and rainfall totals just over 0.50 inches. A stronger storm complex in Kit Carson and Lincoln County produced totals just over 1 inch and hail up to 1.75 inches. MRMS QPE has totals up to 1.75 inches and AHPS QPE has totals just under 1.5 inches, so the truth is probably somewhere in the middle. A gauge north of Genoa recorded 0.53 inches. Flooding was not reported with these storms yesterday.
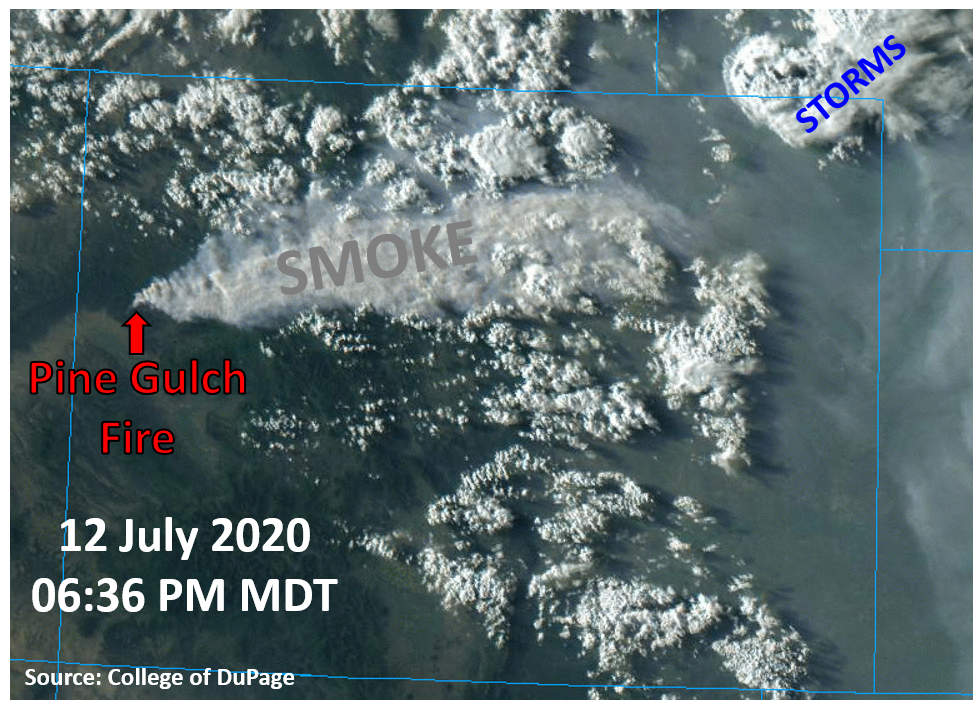
Quick fire update:
Pine Gulch – north of Grand Junction: 76,183 acres; 7% contained (will likely move to the 4th largest in the state’s history over the next few days)
Grizzly Creek – Glenwood Canyon: 25,690 acres; 0% contained
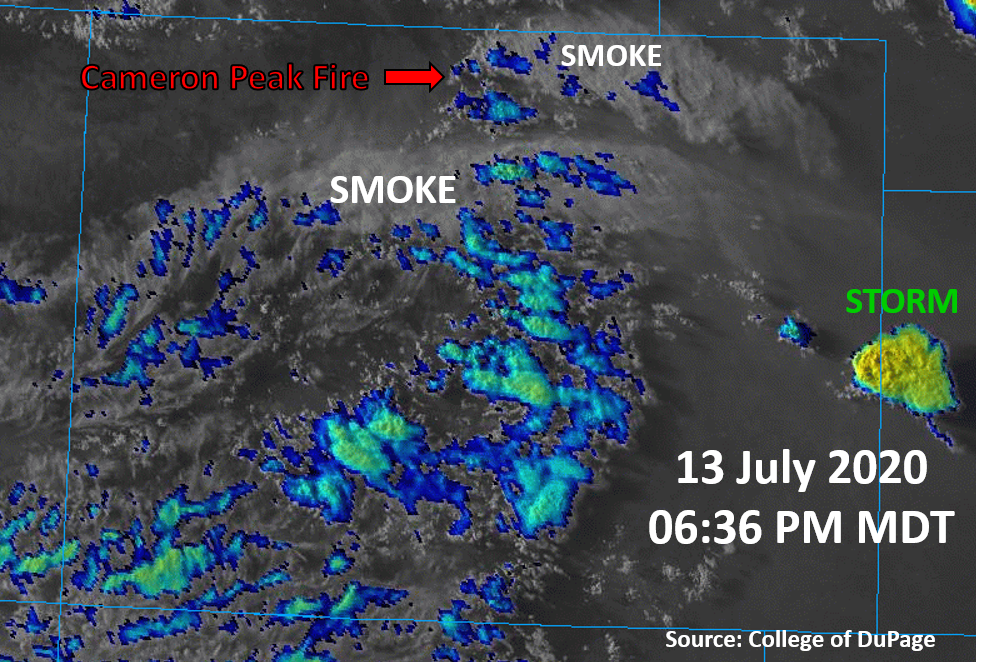
Cameron Peak – Medicine Bow Mountains: 10,867 acres; 0% contained
Williams Fork – Arapho National Forecast: 4,300 acres; 0% (+ ~3,000 acres in 1 day)

To see precipitation estimates over your neighborhood the last 72-hours, scroll down to the State Precipitation Map below.

Click Here For Map Overview

The map below shows radar-estimated, rainfall gage-adjusted Quantitative Precipitation Estimates (QPE) across Colorado. The map is updated daily during the operational season (May 1 – Sep 30) by 11AM. The following six layers are currently available: 24-hour, 48-hour and 72-hour total precipitation, as well as maximum 1-hour, 2-hour and 6-hour precipitation over the past 24 hour period (to estimate where flash flooding may have occurred). The accumulation ending time is 7AM of the date shown in the bottom right corner. Also shown optionally are vulnerable fire burn areas (post 2012), which are updated throughout the season to include new, vulnerable burn areas. The home button in the top left corner resets the map to the original zoom.

Note: The 24-hour, 48-hour and 72-hour total precipitation do not contain bias corrections today due to errors in the CoCoRaHS data. This means there may be underestimations in QPE over the southwest and southeast corners of the state.

SPM 08-15-2020: More Fires & Smoke with an Isolated Severe Thunderstorm for Prowers County

Issue Date: Saturday, August 15th, 2020
Issue Time: 10AM MDT

Summary:

Quite a remarkable moisture boundary set up near the surface Low yesterday afternoon. The surface map below shows dew points in green. So back to the west and over the mountains dew points were in the low teens to mid 30Fs, which is very dry. As you moved east, dew points rose into the 50Fs over the Northeast Plains. Typically, 55F is about what you need to generate a severe thunderstorm. Over the far southeast corner, dew points around the Low ranged from 39F (west) to 55F (north) to 70F (east). This gradient in moisture is what lead to the severe thunderstorm over Kansas (partially shown below) dropping around 2 inches in its core compared to the severe thunderstorm over Prowers County dropping under a half of inch of rainfall in its core. The storm over Kansas was in the Cimarron National Grasslands, so not many observations except a 0.78 inch CoCoRaHS report near the OK/KS/CO border. However, with dew points this high, and a nearly stationary storm, the higher totals are more believable. Cimarron River near Elkhart also showed a slight spike in the stream gage. Hail 2 inches in diameter (hen egg) was also reported with the left-splitting storm over Prowers County. Rainfall totals were under 0.25 inches from the storms that formed over the southern and eastern San Juan Mountains. Lastly, early this morning, some convection was generated over the Raton Ridge, and QPE was estimated at 0.5 inches. Flooding was not reported as of this morning for any of the storms yesterday.

Quick fire update:
Pine Gulch – north of Grand Junction: 74,702 acres; 7% contained (now the 5th largest in the states history)
Grizzly Creek – Glenwood Canyon: 19,440 acres; 0% contained
Cameron Peak – Medicine Bow Mountains: 5,424 acres; 0% contained
Williams Fork – Arapho National Forecast: 1,300 acres; 0% (new fire)

To see precipitation estimates over your neighborhood the last 24 to 72-hours, scroll down to the State Precipitation Map below. Again, the precipitation generated over Lincoln County is an artifact of the wind turbines in the area.

Click Here For Map Overview

The map below shows radar-estimated, rainfall gage-adjusted Quantitative Precipitation Estimates (QPE) across Colorado. The map is updated daily during the operational season (May 1 – Sep 30) by 11AM. The following six layers are currently available: 24-hour, 48-hour and 72-hour total precipitation, as well as maximum 1-hour, 2-hour and 6-hour precipitation over the past 24 hour period (to estimate where flash flooding may have occurred). The 24-hour, 48-hour and 72-hour total precipitation contain bias corrections that are not disaggregated into the hourly estimates, so there will likely be some differences. The accumulation ending time is 7AM of the date shown in the bottom right corner. Also shown optionally are vulnerable fire burn areas (post 2012), which are updated throughout the season to include new, vulnerable burn areas. The home button in the top left corner resets the map to the original zoom.

SPM 08-14-2020: More Wildfire Smoke Than Rain

Issue Date: Friday, August 14th, 2020
Issue Time: 09:25AM MDT

Summary:

A new wildfire ignited yesterday over western Larimer County, which is adding to the already large amounts of smoke filling the skies over northern Colorado, as seen on the visible + infrared satellite image last evening (see below). This new Cameron Peak Fire has quickly grown to 1,537 acres as of this morning. The Pine Gulch Fire near Grand Junction has now grown to 73,381 acres with 7% containment as of this morning, making it the 5th largest wildfire in Colorado history. The Grizzly Creek Fire also grew to 14,663 acres, and I-70 remains closed for the foreseeable future. The hot, dry and windy conditions this week on top of a worsening drought situation has allowed these fires to rapidly expand. Smoke from the fires is creating unhealthy air quality throughout the northern/western mountains and along the Urban Corridor. The new drought map that was released this week showed D3 (Extreme Drought) worsening over the Grand Valley and southern mountains.

A couple of lone storms fired near the eastern border of Colorado yesterday, in Kit Carson and Cheyenne counties, but rain accumulations were minimal. One of these storms can be seen on the satellite image below. The highest CoCoRaHS 24-hour rain accumulation was 0.26 inches in Cheyenne Wells. QPE below indicates higher rain totals up to 0.75 inches to the southeast of Cheyenne Wells, but no rain gauges are available in this area for verification. The second storm core passed to the south of Burlington, just north in Kit Carson County, but only 0.04 inches of rain was reported in Burlington. A Weather Underground station south of Burlington, closer to the storm core, picked up 0.1 inches. Note that the reflectivity over Lincoln County is not real, but likely wind farm interference again.

For rainfall estimates in your area over the last 72 hours, check out our State Precipitation Map below.

Click Here For Map Overview

The map below shows radar-estimated, rainfall gage-adjusted Quantitative Precipitation Estimates (QPE) across Colorado. The map is updated daily during the operational season (May 1 – Sep 30) by 11AM. The following six layers are currently available: 24-hour, 48-hour and 72-hour total precipitation, as well as maximum 1-hour, 2-hour and 6-hour precipitation over the past 24 hour period (to estimate where flash flooding may have occurred). The 24-hour, 48-hour and 72-hour total precipitation contain bias corrections that are not disaggregated into the hourly estimates, so there will likely be some differences. The accumulation ending time is 7AM of the date shown in the bottom right corner. Also shown optionally are vulnerable fire burn areas (post 2012), which are updated throughout the season to include new, vulnerable burn areas. The home button in the top left corner resets the map to the original zoom.

SPM 08-13-2020: Afternoon & Overnight Convection Brings Rain for Plains, Smoke Impacts Mountains & Urban Corridor

Issue Date: Wednesday, August 5th, 2020
Issue Time: 10:55AM MDT

Summary:

Some rainfall was observed along portions of the eastern plains, but rain gauge observations indicate totals were only up to 0.3 inches over the last 24 hours. The northeastern corner of the state saw one round of storms straddling the Colorado/Nebraska border between 4:30PM and 8:30PM MDT, which are visible on the satellite image from last evening (see below). However, the majority of rainfall fell overnight between 9:30PM and 12:30AM MDT as a cluster of storms moved through Logan, Sedgwick, and Phillips counties. The highest rain accumulation from these storms was 0.23 inches from a CoCoRaHS observer in northwest Phillips County. QPE indicates the heaviest rain from these storms fell over northern Sedgwick County, with bias-corrected MetStorm Live QPE indicating up to 0.5 inches and MRMS QPE suggesting just over 1 inch may have fallen. No rain gauges were available in the heaviest rain core to verify these QPE totals.

A second batch of nocturnal convection dropped some rain just north and east of the Palmer Ridge, with the heavier showers moving through between 2:30AM and 5:30AM MDT. Today’s QPE map shows totals just over 0.5 inches of rain fell over southern Washington County from these convective showers, but the closest rain gauge observations are 0.10 inch along the western and 0.08 inch along the eastern edges of this storm track. A band of convective showers further south produced up to 0.29 inches of rain in Cheyenne County. No flooding was reported with these nocturnal storms.

The Pine Gulch and Grizzly Creek wildfires continued produce copious amounts of smoke over the central and northern mountains yesterday, which was easily visible on the satellite imagery last evening (see image below). The Pine Gulch wildfire has reached an impressive 68,323 acres as of this morning, and the Grizzly Creek wildfire has grown to 4,624 acres as of late last night. The smoke from these fires is causing air quality issues for much of the Grand Valley, Central & Northern Mountains, and along the Front Range & Urban Corridor. Unfortunately with continued dry weather expected today, we will likely be dealing with smoke again today.

For rainfall estimates in your area over the last 72 hours, check out our State Precipitation Map below.

Click Here For Map Overview

The map below shows radar-estimated, rainfall gage-adjusted Quantitative Precipitation Estimates (QPE) across Colorado. The map is updated daily during the operational season (May 1 – Sep 30) by 11AM. The following six layers are currently available: 24-hour, 48-hour and 72-hour total precipitation, as well as maximum 1-hour, 2-hour and 6-hour precipitation over the past 24 hour period (to estimate where flash flooding may have occurred). The 24-hour, 48-hour and 72-hour total precipitation contain bias corrections that are not disaggregated into the hourly estimates, so there will likely be some differences. The accumulation ending time is 7AM of the date shown in the bottom right corner. Also shown optionally are vulnerable fire burn areas (post 2012), which are updated throughout the season to include new, vulnerable burn areas. The home button in the top left corner resets the map to the original zoom.