Issue Date: Friday, August 14th, 2020
Issue Time: 09:25AM MDT
Summary:
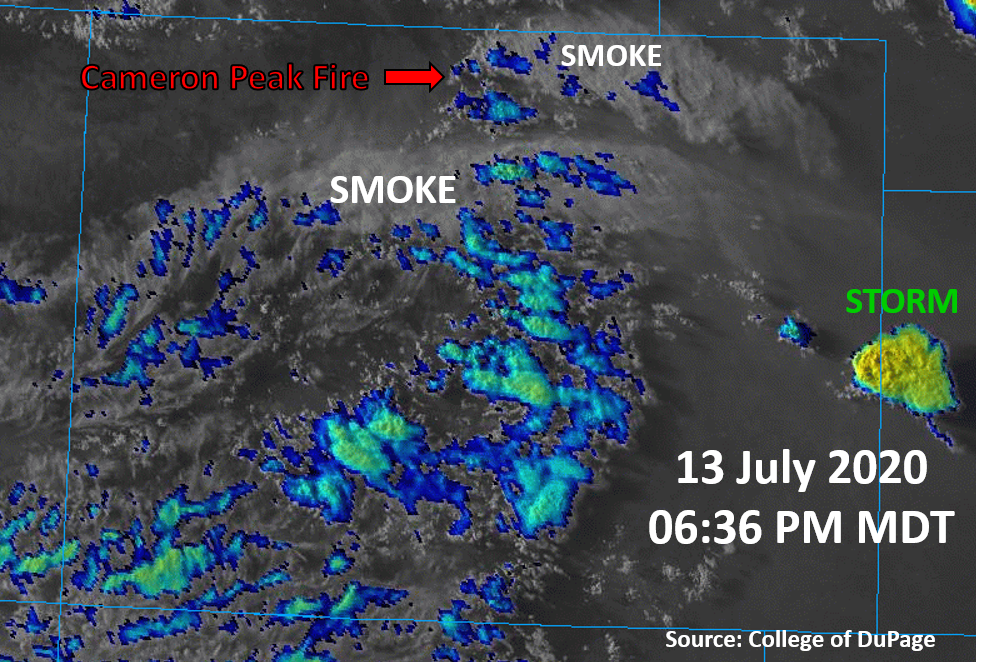
A new wildfire ignited yesterday over western Larimer County, which is adding to the already large amounts of smoke filling the skies over northern Colorado, as seen on the visible + infrared satellite image last evening (see below). This new Cameron Peak Fire has quickly grown to 1,537 acres as of this morning. The Pine Gulch Fire near Grand Junction has now grown to 73,381 acres with 7% containment as of this morning, making it the 5th largest wildfire in Colorado history. The Grizzly Creek Fire also grew to 14,663 acres, and I-70 remains closed for the foreseeable future. The hot, dry and windy conditions this week on top of a worsening drought situation has allowed these fires to rapidly expand. Smoke from the fires is creating unhealthy air quality throughout the northern/western mountains and along the Urban Corridor. The new drought map that was released this week showed D3 (Extreme Drought) worsening over the Grand Valley and southern mountains.
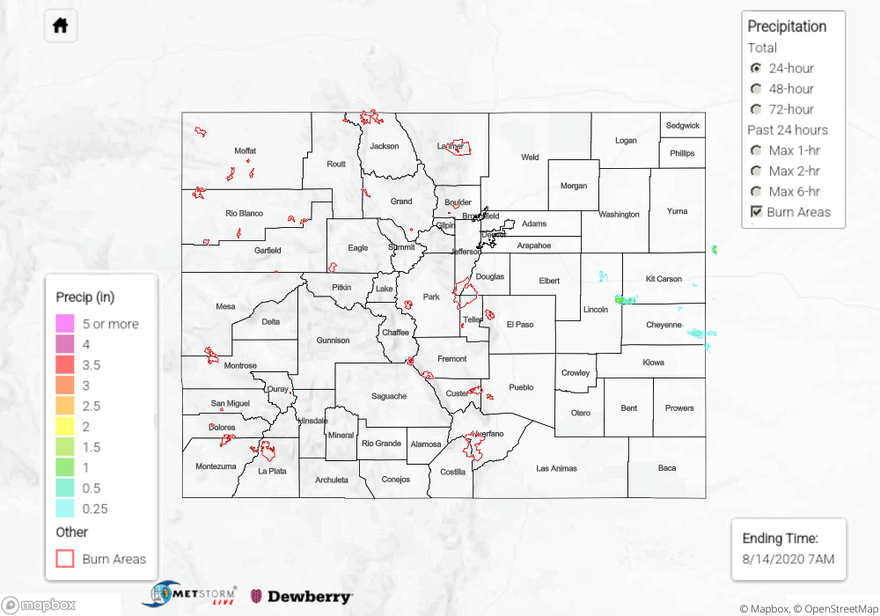
A couple of lone storms fired near the eastern border of Colorado yesterday, in Kit Carson and Cheyenne counties, but rain accumulations were minimal. One of these storms can be seen on the satellite image below. The highest CoCoRaHS 24-hour rain accumulation was 0.26 inches in Cheyenne Wells. QPE below indicates higher rain totals up to 0.75 inches to the southeast of Cheyenne Wells, but no rain gauges are available in this area for verification. The second storm core passed to the south of Burlington, just north in Kit Carson County, but only 0.04 inches of rain was reported in Burlington. A Weather Underground station south of Burlington, closer to the storm core, picked up 0.1 inches. Note that the reflectivity over Lincoln County is not real, but likely wind farm interference again.
For rainfall estimates in your area over the last 72 hours, check out our State Precipitation Map below.
Click Here For Map Overview