SPM 08-24-2020: Heat Wave Continues

Issue Date: Monday, August 24th, 2020
Issue Time: 9:08AM MDT

Summary:

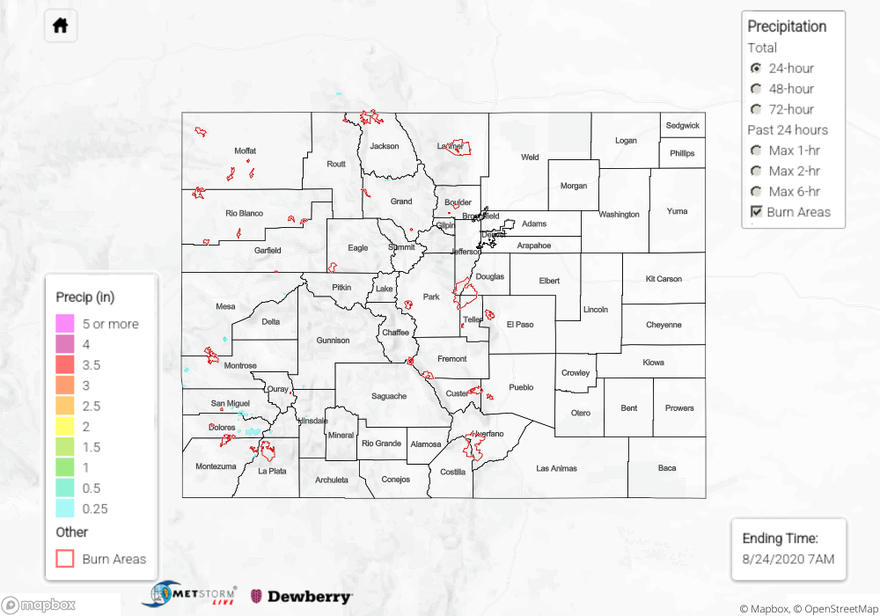
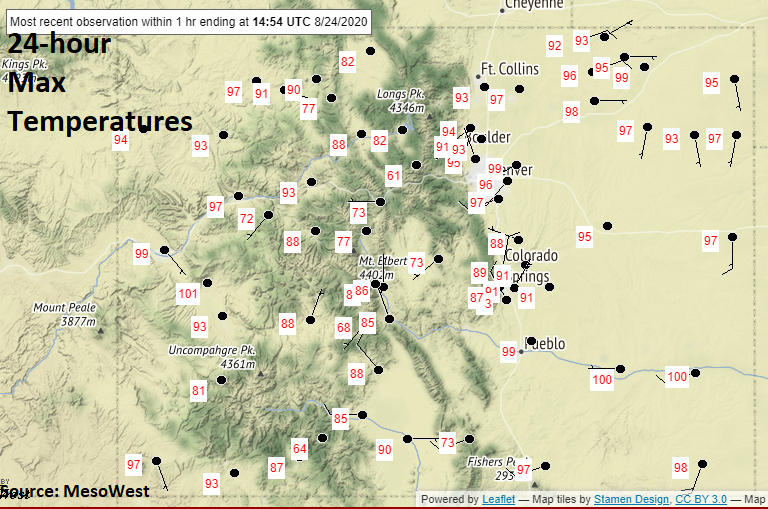
The heat wave continues with 24-hour maximum temperatures below from NWS ASOS stations. A few daily high records were set across the state with a couple monthly high temperatures records set as well over the Central Mountains. The increased smoke also made it feel much later in the day (darker) as the sun started to set in the Denver Metro. Overall, it was quiet on the rainfall front with just some high-based showers over the mountains. The highest observation was in eastern Dolores County where a CoCoRaHS picked up 0.26 inches of rainfall. Most other areas picked up between trace amounts and 0.10 inches. A new fire started in Park County (Thorpe Fire) near Tarryall. As of 8PM last night, 150 acres had burned.

Ongoing large fire update (as of 9AM on InciWeb):
Pine Gulch – north of Grand Junction: 133,783 acres; 44% contained

Grizzly Creek – Glenwood Canyon: 30,719 acres; 33% contained

Cameron Peak – Medicine Bow Mountains: 20,118 acres; 0% contained

Williams Fork – Arapho National Forecast: 11,048 acres; 3% contained

To see precipitation estimates over your area the last 24 to 48-hours, scroll down to the State Precipitation Map below.

Click Here For Map Overview

The map below shows radar-estimated, rainfall gage-adjusted Quantitative Precipitation Estimates (QPE) across Colorado. The map is updated daily during the operational season (May 1 – Sep 30) by 11AM. The following six layers are currently available: 24-hour, 48-hour and 72-hour total precipitation, as well as maximum 1-hour, 2-hour and 6-hour precipitation over the past 24 hour period (to estimate where flash flooding may have occurred). The 24-hour, 48-hour and 72-hour total precipitation contain bias corrections that are not disaggregated into the hourly estimates, so there will likely be some differences. The accumulation ending time is 7AM of the date shown in the bottom right corner. Also shown optionally are vulnerable fire burn areas (post 2012), which are updated throughout the season to include new, vulnerable burn areas. The home button in the top left corner resets the map to the original zoom.

SPM 08-23-2020: Southern Mountain Storms Bring Isolated Light Rainfall

Issue Date: Sunday, August 23rd, 2020
Issue Time: 10:15AM MDT

Summary:

Storms stuck to the southern mountains yesterday, producing up to 0.31 inches of rainfall near Cortez (Southwest Slope) according to rain gauges. A similar total of 0.29 inches was recorded near the CO/NM border southeast of Durango. Radar indicates storms fired over the San Juan Mountains and moved south over these areas over an hour or two during the early afternoon. These rain totals match well with the expected rain rates for the area (0.3 in/hr) in yesterday’s Flood Threat Bulletin. Further east, along the western edge of the Southeast Mountains, rain totals up to 0.1 inches were reported by CoCoRaHS observers.

Storms were unable to break the cap over the eastern border yesterday, even though the low pressure system set up a convergence boundary over Kit Carson County. It is possible the thick smoke over eastern Colorado yesterday may have reinforced this cap with mid-level heating from absorption of sunlight by dark smoke particles, potentially suppressing storms over the eastern border.

Temperatures soared again across the state, as Denver reached 97F (1F shy of tying the record), Grand Junction reached 98F (beat old record by 1F), and Pueblo reached 103F (beat old record by 3F). These hot temperatures are surprising considering the amount of smoke that lingered over the state yesterday, but the drier air and drought conditions likely are exacerbating the heat.

Wildfires continued to burn across Colorado yesterday (see updated info below). These CO fires along with fires across the US West are generating large amounts of smoke, which is blanketing much of the US West and causing unhealthy air quality. Check out this interactive map from AirNow that shows smoke plumes and air quality across the US:

https://fire.airnow.gov

Wildfire Update:
Pine Gulch – north of Grand Junction: 129,715 acres; 19% contained (2nd largest CO wildfire, grew ~ 3,000 acres)
Grizzly Creek – Glenwood Canyon: 30,362 acres; 30% contained (increase in containment)
Cameron Peak – Medicine Bow Mountains: 18,287 acres; 0% contained (grew ~ 1,000 acres)
Williams Fork – Arapaho National Forest: 10,813 acres; 3% contained

For rainfall estimates in your area over the last 24, 48, and 72 hours, check out our State Precipitation Map below.

Click Here For Map Overview

The map below shows radar-estimated, rainfall gage-adjusted Quantitative Precipitation Estimates (QPE) across Colorado. The map is updated daily during the operational season (May 1 – Sep 30) by 11AM. The following six layers are currently available: 24-hour, 48-hour and 72-hour total precipitation, as well as maximum 1-hour, 2-hour and 6-hour precipitation over the past 24 hour period (to estimate where flash flooding may have occurred). The 24-hour, 48-hour and 72-hour total precipitation contain bias corrections that are not disaggregated into the hourly estimates, so there will likely be some differences. The accumulation ending time is 7AM of the date shown in the bottom right corner. Also shown optionally are vulnerable fire burn areas (post 2012), which are updated throughout the season to include new, vulnerable burn areas. The home button in the top left corner resets the map to the original zoom.

SPM 08-22-2020: Dry and Smoky

Issue Date: Saturday, August 22nd, 2020
Issue Time: 10:45AM MDT

Summary:

Other than a few clouds over some of the high terrains yesterday, Colorado’s clear skies were infiltrated with wildfire smoke. The image below shows the experimental near-surface smoke concentration from the HRRR weather model at 6PM last evening. The reds and purple colors indicate high concentrations of near-surface smoke. There is a large plume of smoke streaming from California wildfires across the US West and into northern Colorado. Increased smoke concentrations can also be seen coming from the Pine Gulch and Cameron Peak fires in Colorado. This abundance of smoke is decreasing air quality for much of Colorado and the US West, and will likely continue to do so for some time. A summary update on Colorado’s current wildfires is below.

Temperatures remained above average across Colorado yesterday, with Denver and Grand Junction reaching into the mid and upper 90Fs. With another week of temperatures in the 90Fs for Denver, this puts Denver in 2nd place for the most 90 degree days in a year. NWS Denver/Boulder has a nice graphic in their weather story today with more info on the summer heat (https://www.weather.gov/bou/weatherstory). With continued heat expected over the next week, we will inch closer to the all-time record set in 2012!

Wildfire Update:
Pine Gulch – north of Grand Junction: 126,613 acres; 19% contained (2nd largest CO wildfire; progress on containment)
Grizzly Creek – Glenwood Canyon: 29,992 acres; 22% contained (progress on containment)
Cameron Peak – Medicine Bow Mountains: 17,246 acres; 0% contained
Williams Fork – Arapaho National Forest: 10,437 acres; 3% contained

Check your local rainfall estimates from the last 24, 48, and 72 hours using our State Precipitation Map below.

Click Here For Map Overview

The map below shows radar-estimated, rainfall gage-adjusted Quantitative Precipitation Estimates (QPE) across Colorado. The map is updated daily during the operational season (May 1 – Sep 30) by 11AM. The following six layers are currently available: 24-hour, 48-hour and 72-hour total precipitation, as well as maximum 1-hour, 2-hour and 6-hour precipitation over the past 24 hour period (to estimate where flash flooding may have occurred). The 24-hour, 48-hour and 72-hour total precipitation contain bias corrections that are not disaggregated into the hourly estimates, so there will likely be some differences. The accumulation ending time is 7AM of the date shown in the bottom right corner. Also shown optionally are vulnerable fire burn areas (post 2012), which are updated throughout the season to include new, vulnerable burn areas. The home button in the top left corner resets the map to the original zoom.

SPM 08-21-2020: Heavy Rainfall and Street Flooding Over Colorado Springs

Issue Date: Friday, August 21st, 2020
Issue Time: 10:05AM MDT

Summary:

Some moderate moisture was able to hang on yesterday afternoon over the Palmer Ridge and eastern plains. As storms developed over the mountains and moved into the adjacent plains, heavy rainfall occurred over El Paso County. A complex of convection developed over the Colorado Springs area just before 6PM and dropped some heavy rainfall along with pea sized hail. USGS gages were just under an inch near the Air Force Academy, and a station near Fort Carson recorded 1.31 inches. The largest storm report was 2.1 inches (in 30 minutes) near North Powers Blvd and Constitution Ave, but other CoCoRaHS reports and local storm reports in the area indicate this is likely an overestimation. Nonetheless, nuisance street flooding was reported at Austin Bluffs and Academy where water accumulated to 6 inches in depth. Best guess for the heaviest rainfall is between 1.25 and just over 1.5 inches, and higher totals make sense over eastern El Paso and western Lincoln counties. The slower storm movement really helped increase the total rainfall along with dew points near or just above 50F.

Storms also returned to the mountains, but with most of the moisture in the upper levels, storms produce some strong wind gusts. Along I-70, 50 to 60 mph gusts were recorded at Garfield County Airport and Eagle County Airport. As for rain, isolated totals between 0.25 and 0.60 inches were estimated with a CoCoRaHS report of 0.23 inches in southern Archuleta County. Overall, storms were very efficient on the rainfall front yesterday.

Fire update (as of 10AM on InciWeb):
Pine Gulch – north of Grand Junction: 124,934 acres; 17% contained

Grizzly Creek – Glenwood Canyon: 29,992 acres; 11% contained

Cameron Peak – Medicine Bow Mountains: 16,461 acres; 0% contained (14hrs ago)

Williams Fork – Arapho National Forecast: 10,288 acres; 3% contained

To see precipitation estimates over your neighborhood the last 24-hours, scroll down to the State Precipitation Map below.

Click Here For Map Overview

The map below shows radar-estimated, rainfall gage-adjusted Quantitative Precipitation Estimates (QPE) across Colorado. The map is updated daily during the operational season (May 1 – Sep 30) by 11AM. The following six layers are currently available: 24-hour, 48-hour and 72-hour total precipitation, as well as maximum 1-hour, 2-hour and 6-hour precipitation over the past 24 hour period (to estimate where flash flooding may have occurred). The accumulation ending time is 7AM of the date shown in the bottom right corner. Also shown optionally are vulnerable fire burn areas (post 2012), which are updated throughout the season to include new, vulnerable burn areas. The home button in the top left corner resets the map to the original zoom.

Note: The 24-hour, 48-hour and 72-hour total precipitation do not contain bias corrections today due to errors in the CoCoRaHS data. This means there may be underestimations in QPE over the southwest and southeast corners of the state.