Issue Date: Friday, August 21st, 2020
Issue Time: 10:05AM MDT
Summary:
Some moderate moisture was able to hang on yesterday afternoon over the Palmer Ridge and eastern plains. As storms developed over the mountains and moved into the adjacent plains, heavy rainfall occurred over El Paso County. A complex of convection developed over the Colorado Springs area just before 6PM and dropped some heavy rainfall along with pea sized hail. USGS gages were just under an inch near the Air Force Academy, and a station near Fort Carson recorded 1.31 inches. The largest storm report was 2.1 inches (in 30 minutes) near North Powers Blvd and Constitution Ave, but other CoCoRaHS reports and local storm reports in the area indicate this is likely an overestimation. Nonetheless, nuisance street flooding was reported at Austin Bluffs and Academy where water accumulated to 6 inches in depth. Best guess for the heaviest rainfall is between 1.25 and just over 1.5 inches, and higher totals make sense over eastern El Paso and western Lincoln counties. The slower storm movement really helped increase the total rainfall along with dew points near or just above 50F.
Storms also returned to the mountains, but with most of the moisture in the upper levels, storms produce some strong wind gusts. Along I-70, 50 to 60 mph gusts were recorded at Garfield County Airport and Eagle County Airport. As for rain, isolated totals between 0.25 and 0.60 inches were estimated with a CoCoRaHS report of 0.23 inches in southern Archuleta County. Overall, storms were very efficient on the rainfall front yesterday.
Fire update (as of 10AM on InciWeb):
Pine Gulch – north of Grand Junction: 124,934 acres; 17% contained
Grizzly Creek – Glenwood Canyon: 29,992 acres; 11% contained
Cameron Peak – Medicine Bow Mountains: 16,461 acres; 0% contained (14hrs ago)
Williams Fork – Arapho National Forecast: 10,288 acres; 3% contained
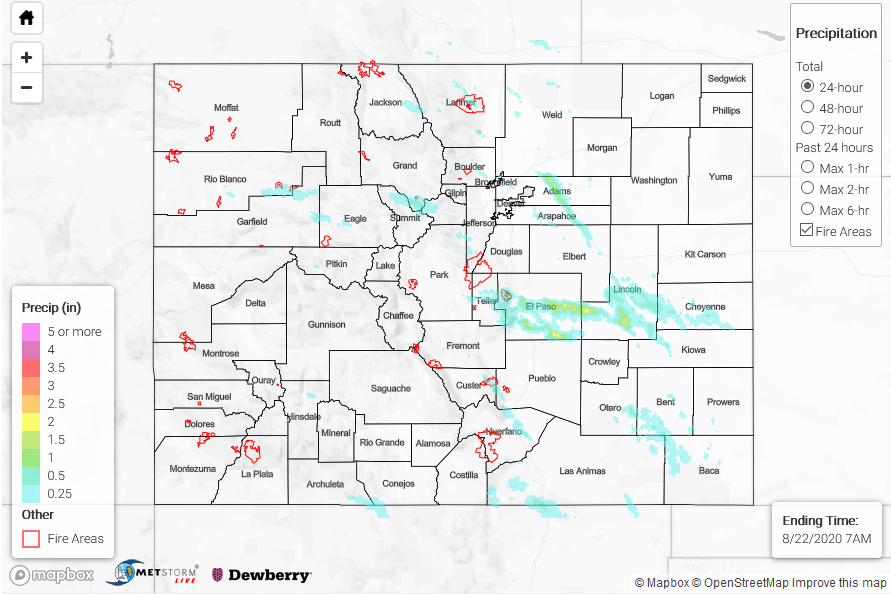
To see precipitation estimates over your neighborhood the last 24-hours, scroll down to the State Precipitation Map below.
Click Here For Map Overview
Note: The 24-hour, 48-hour and 72-hour total precipitation do not contain bias corrections today due to errors in the CoCoRaHS data. This means there may be underestimations in QPE over the southwest and southeast corners of the state.