SPM 09-13-2020: Dry and Smoke Free… For Now

Issue Date: Sunday, September 13th, 2020
Issue Time: 09:30AM MDT

Summary:

Yesterday was quite dry across the state, but a few clouds were able to pop over the mountains. These clouds do not appear to have caused any significant measurable precipitation as most rain gauge networks this morning show no accumulation. One USGS gage near Ridgway, CO is reporting 0.01” of accumulation over the last 24 hours. A second nearby USGS gage reported 0.21” of accumulation, but this is likely an artifact of snowmelt as temperatures climbed to near 70F near Ridgway yesterday. Hopefully you were able to enjoy the clear, smoke-free skies yesterday because that will likely change this week.

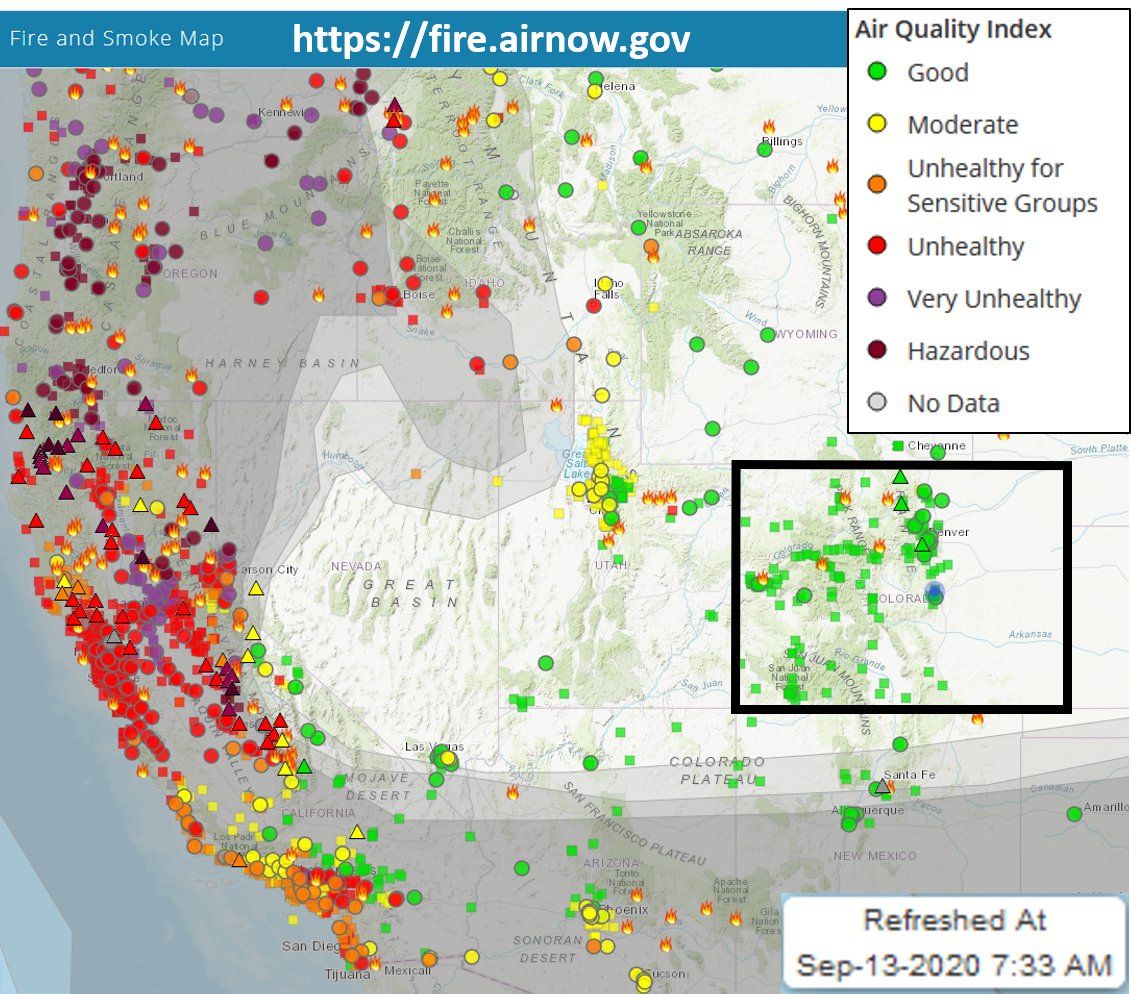
The image below shows the impact of the wildfires in the US West on air quality. Note that many locations along the west coast are in the Very Unhealthy and even Hazardous air quality index values. Smoke working its way eastward around the High pressure ridge has already dropped air quality in northern Utah to Moderate levels. Fortunately, Colorado is experiencing Good air quality currently after the Low pressure system that brought us rain and snow last week cleaned out the smoke. Unfortunately, this smoke will once again move its way eastward and effect the air quality in Colorado this week. The US West desperately needs precipitation to help quell the rampant wildfires, but little relief looks likely in the short-term forecast.

Ongoing Colorado wildfires update (as of 9:30AM from InciWeb):
Cameron Peak in the Medicine Bow Mountains: 102,596 acres; 4% contained
Williams Fork in the Arapaho National Forest: 12,157 acres; 10% contained
Grizzly Creek in Glenwood Canyon: 32,431 acres; 91% contained
Pine Gulch north of Grand Junction: 139,007 acres; 95% contained

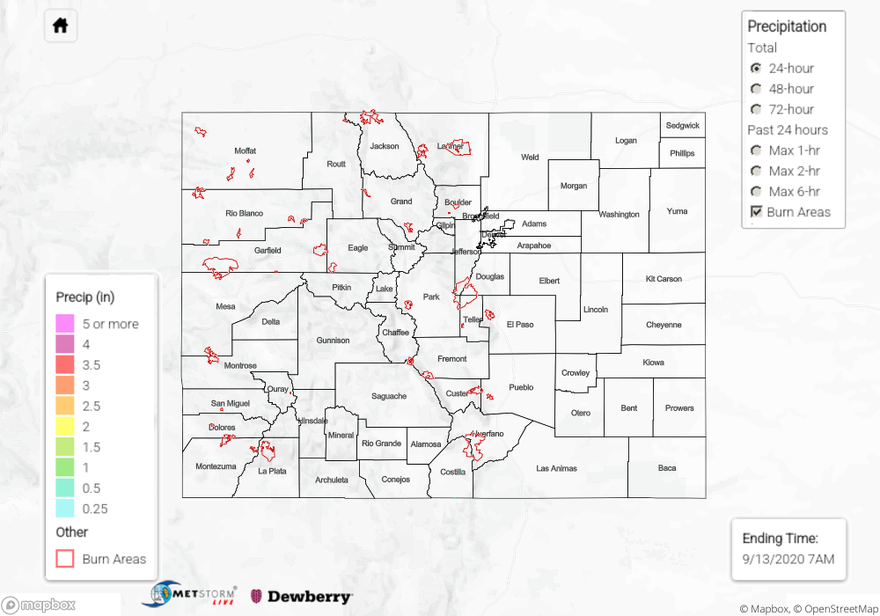
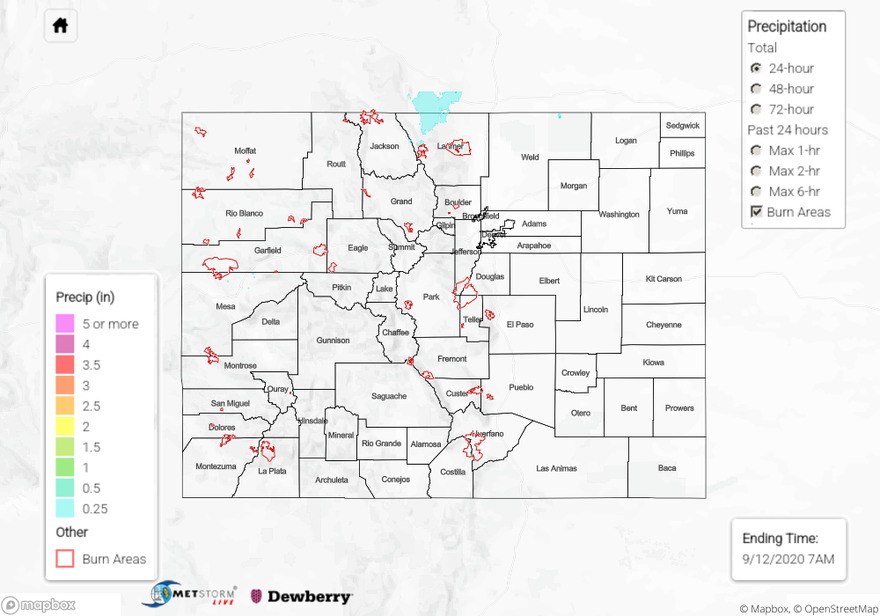
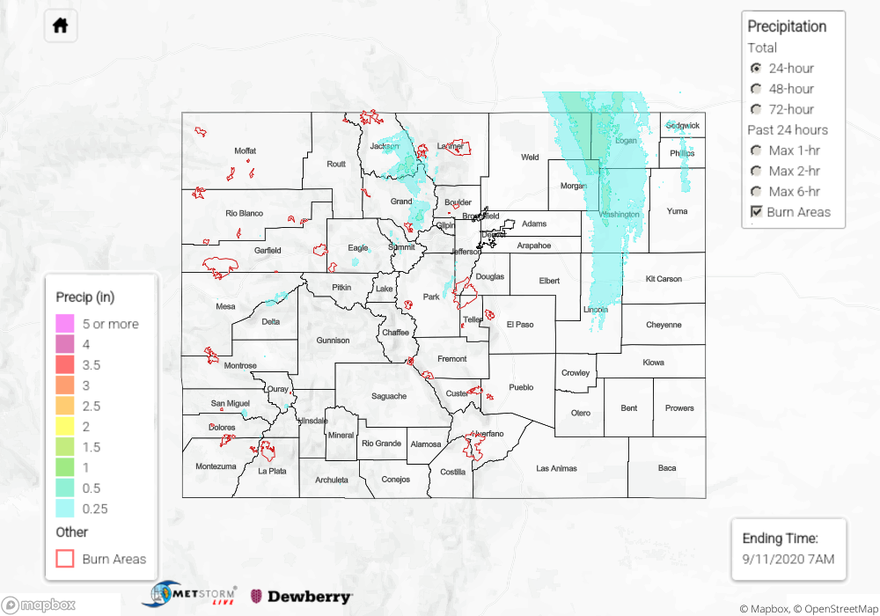
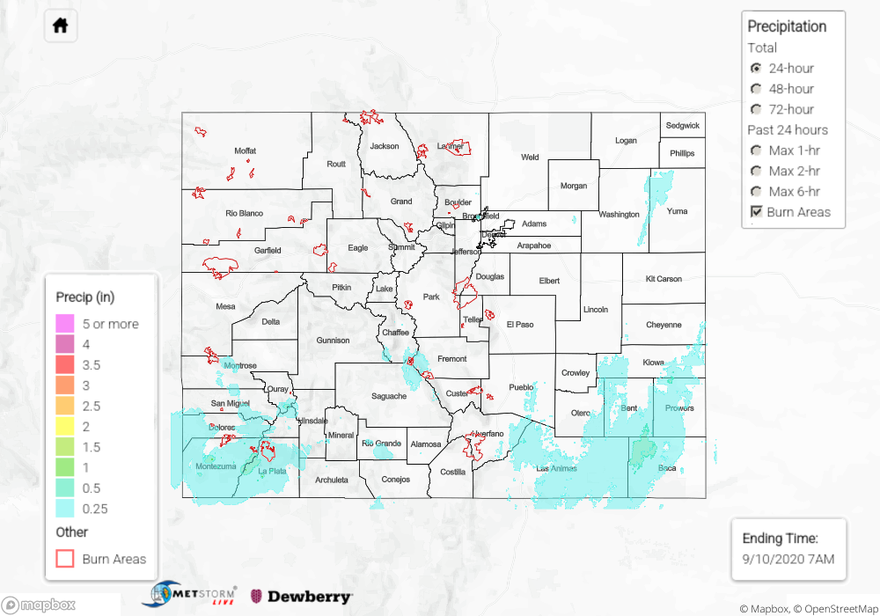
Check out our State Precipitation Map below to see how much precipitation fell in your neighborhood over the last 24, 48, or 72 hours.

Click Here For Map Overview

The map below shows radar-estimated, rainfall gage-adjusted Quantitative Precipitation Estimates (QPE) across Colorado. The map is updated daily during the operational season (May 1 – Sep 30) by 11AM. The following six layers are currently available: 24-hour, 48-hour and 72-hour total precipitation, as well as maximum 1-hour, 2-hour and 6-hour precipitation over the past 24 hour period (to estimate where flash flooding may have occurred). The 24-hour, 48-hour and 72-hour total precipitation contain bias corrections that are not disaggregated into the hourly estimates, so there will likely be some differences. The accumulation ending time is 7AM of the date shown in the bottom right corner. Also shown optionally are vulnerable fire burn areas (post 2012), which are updated throughout the season to include new, vulnerable burn areas. The home button in the top left corner resets the map to the original zoom.

SPM 09-12-2020: Light Precipitation for Northern Front Range and Plains

Issue Date: Saturday, September 12th, 2020
Issue Time: 09:35AM MDT

Summary:

Some light rain & snow showers impacted the northern Front Range and plains yesterday from wrap-around moisture associated with the departing Low. QPE sources (MetStormLive and MRMS) indicate near and just over 0.25 inches of precipitation fell since 6am yesterday over northern Larimer County. Some of this precipitation may have fallen as snow over the higher elevations near the Continental Divide, but most locations got above freezing yesterday. A couple MesoWest stations in western Larimer County show 0.41 to 0.48 inches of precipitation fell yesterday morning and early afternoon, but these automated stations may be suffering from snowmelt from previous days as this accumulation period was co-located with temperatures climbing above freezing. Regardless, this precipitation is welcomed near the Cameron Peak wildfire. Less than 0.20 inches of accumulation generally fell in northern Weld County according to QPE, but the highest rain gauge accumulation found was 0.08 inches from a Weather Underground station.

Some gusty winds were generated along the Continental Divide in the Front Range as the stronger winds from the upper-level Low moved over the area. Berthoud Pass saw a wind gust up to 60 mph, and other automated weather stations near or just east of the Divide saw gusts in the 40 mph range. These winds appear to be dying down this morning. Fortunately the recent moisture has lessened the impact of these stronger winds as all the major fires burning in Colorado have remained in the smoldering stage with no additional growth (see info below). Firefighters have been and are continuing work on increasing containment of these fires during this more favorable weather window, but increasing temperatures and little precipitation over the next week will not help make the fire situation much better.

Ongoing Colorado wildfires update (as of 9:25AM from InciWeb):
Cameron Peak in the Medicine Bow Mountains: 102,596 acres; 4% contained
Williams Fork in the Arapaho National Forest: 12,157 acres; 10% contained
Grizzly Creek in Glenwood Canyon: 32,431 acres; 91% contained
Pine Gulch north of Grand Junction: 139,007 acres; 95% contained

For precipitation estimates in your area over the last 24 to 72 hours, check out our State Precipitation Map below.

Click Here For Map Overview

The map below shows radar-estimated, rainfall gage-adjusted Quantitative Precipitation Estimates (QPE) across Colorado. The map is updated daily during the operational season (May 1 – Sep 30) by 11AM. The following six layers are currently available: 24-hour, 48-hour and 72-hour total precipitation, as well as maximum 1-hour, 2-hour and 6-hour precipitation over the past 24 hour period (to estimate where flash flooding may have occurred). The 24-hour, 48-hour and 72-hour total precipitation contain bias corrections that are not disaggregated into the hourly estimates, so there will likely be some differences. The accumulation ending time is 7AM of the date shown in the bottom right corner. Also shown optionally are vulnerable fire burn areas (post 2012), which are updated throughout the season to include new, vulnerable burn areas. The home button in the top left corner resets the map to the original zoom.

SPM 09-11-2020: Scattered Showers and Snow Continued on Thursday

Issue Date: Friday, September 11th, 2020
Issue Time: 9:21AM MDT

Summary:

As the cutoff Low began to move northeastward, it continued to produce scattered precipitation. There was definitely a weakening in the coverage and intensity of the precipitation yesterday. Additionally, the snow line dropped a bit, so there was some rain on snow over the mid-elevations. Thankfully, the precipitation was light and not widespread, so the melting (warmer temperatures) and rain on snow only caused some rises in a handful of smaller rivers/creeks. Heavier precipitation was further north and over the Northeast Plains. QPE was between 0.25 and 0.60 inches for plains, and the highest observation was 0.54 inches.

Over the mountains, a gauge from the Fort Collins Mesonet picked up 0.87 inches in Rist Canyon. SNOTEL stations in the area had about the same. The Never Summer SNOTEL site in Jackson County (10,280 ft) picked up 1.1 inches. Over the San Juan Mountains, the Columbus Basin SNOTEL also recorded 1.1 inches, so still plenty of precipitation from the Low. A 3.5 inch snow report came in this morning from San Miguel County near Placerville, but that was it for snow reports (as of 9:15AM). While this event wasn’t a drought buster by any means, the Southwest Slope finally got some precipitation! This was also a nice wetting event for the Grand Valley, which includes the Pine Gulch fire. Flooding was not reported on Thursday.

Dense fog formed early this morning over the mountain valleys and Southeast Plains due to the strong radiational cooling. Overnight, Alamosa dipped to 32F, but all the other lower elevations seemed to have stayed above the freezing mark.

Ongoing Colorado wildfires update (as of 9:15AM from InciWeb):
Cameron Peak in the Medicine Bow Mountains: 102,596 acres; 4% contained
Williams Fork in the Arapaho National Forest: 12,157 acres; 10% contained
Pine Gulch north of Grand Junction: 139,007 acres; 95% contained
Grizzly Creek in Glenwood Canyon: 32,431 acres; 91% contained

To see precipitation estimates over your area the last 24-hours and for this storm event (72-hour), scroll down to the State Precipitation Map below.

Click Here For Map Overview

The map below shows radar-estimated, rainfall gage-adjusted Quantitative Precipitation Estimates (QPE) across Colorado. The map is updated daily during the operational season (May 1 – Sep 30) by 11AM. The following six layers are currently available: 24-hour, 48-hour and 72-hour total precipitation, as well as maximum 1-hour, 2-hour and 6-hour precipitation over the past 24 hour period (to estimate where flash flooding may have occurred). The 24-hour, 48-hour and 72-hour total precipitation contain bias corrections that are not disaggregated into the hourly estimates, so there will likely be some differences. The accumulation ending time is 7AM of the date shown in the bottom right corner. Also shown optionally are vulnerable fire burn areas (post 2012), which are updated throughout the season to include new, vulnerable burn areas. The home button in the top left corner resets the map to the original zoom.

SPM 09-10-2020: More Rain and Snow Showers Add to Precipitation Totals

Issue Date: Thursday, September 10th, 2020
Issue Time: 10:25AM MDT

Summary:

Rain and snow fell over mainly the southwest and southeast parts of Colorado yesterday, with much of this precipitation falling after sunset. Total precipitation reports from CoCoRaHS observers in Montezuma and La Plata counties in the Southwest Slope exceed 1 inch over the last 24 hours, with up to 1.26 inches reported. These reports indicate only a small fraction (<10%) fell as snow. Liquid-equivalent precipitation up to 0.61 inches was reported in the San Luis Valley, with 3-5 inches of wet snow falling in some locations. The QPE map shows that over 0.5 inches of precipitation fell over northwestern Baca County in the Southeast Plains. Temperatures were above freezing over the Southeast Plains yesterday, so much of this precipitation likely fell as rain.

The precipitation over the last two days brought much of Colorado at least 0.5 inches of liquid (see 48-hour QPE map), with some locations receiving over 1 inch (southern mountains & Grand Valley). For parts of the southern San Juan Mountains and even into the San Luis Valley, this has translated into 12-24 inches of snow (see 48-hour snowfall analysis image below; Source: NOHRSC). The slightly warmer near- to above-freezing temperatures over the Urban Corridor and plains regions cut down on snow accumulation significantly, with less than 3 inches reported in many locations. A band of heavier snow was able to drop 6-8 inches of snow from western Las Animas County northeastward to western Kit Carson County, but these were the highest totals observed over the plains. Even the Front Range had less-than-expected totals of up to only 8 inches. However, all this moisture and snowfall has been extremely helpful to suppress wildfires, at least for now. Up to 18 inches of snow fell over the Pine Gulch fire, up to 12 inches fell over the Grizzly Creek fire, up to 8 inches fell over the Cameron Peak fire, and up to 2 inches fell over the Williams Fork fire.

Large Colorado wildfire update (as of 10:20AM on InciWeb):
Cameron Peak in the Medicine Bow Mountains: 102,596 acres; 4% contained
Williams Fork in the Arapaho National Forest: 12,157 acres; 10% contained
Grizzly Creek in Glenwood Canyon: 32,464 acres; 91% contained
Pine Gulch north of Grand Junction: 139,007 acres; 95% contained

For liquid-equivalent precipitation estimates in your area over the last 24, 48, and 72 hours, check out our State Precipitation Map below.

Click Here For Map Overview

The map below shows radar-estimated, rainfall gage-adjusted Quantitative Precipitation Estimates (QPE) across Colorado. The map is updated daily during the operational season (May 1 – Sep 30) by 11AM. The following six layers are currently available: 24-hour, 48-hour and 72-hour total precipitation, as well as maximum 1-hour, 2-hour and 6-hour precipitation over the past 24 hour period (to estimate where flash flooding may have occurred). The 24-hour, 48-hour and 72-hour total precipitation contain bias corrections that are not disaggregated into the hourly estimates, so there will likely be some differences. The accumulation ending time is 7AM of the date shown in the bottom right corner. Also shown optionally are vulnerable fire burn areas (post 2012), which are updated throughout the season to include new, vulnerable burn areas. The home button in the top left corner resets the map to the original zoom.