Issue Date: Friday, September 11th, 2020
Issue Time: 9:21AM MDT
Summary:
As the cutoff Low began to move northeastward, it continued to produce scattered precipitation. There was definitely a weakening in the coverage and intensity of the precipitation yesterday. Additionally, the snow line dropped a bit, so there was some rain on snow over the mid-elevations. Thankfully, the precipitation was light and not widespread, so the melting (warmer temperatures) and rain on snow only caused some rises in a handful of smaller rivers/creeks. Heavier precipitation was further north and over the Northeast Plains. QPE was between 0.25 and 0.60 inches for plains, and the highest observation was 0.54 inches.
Over the mountains, a gauge from the Fort Collins Mesonet picked up 0.87 inches in Rist Canyon. SNOTEL stations in the area had about the same. The Never Summer SNOTEL site in Jackson County (10,280 ft) picked up 1.1 inches. Over the San Juan Mountains, the Columbus Basin SNOTEL also recorded 1.1 inches, so still plenty of precipitation from the Low. A 3.5 inch snow report came in this morning from San Miguel County near Placerville, but that was it for snow reports (as of 9:15AM). While this event wasn’t a drought buster by any means, the Southwest Slope finally got some precipitation! This was also a nice wetting event for the Grand Valley, which includes the Pine Gulch fire. Flooding was not reported on Thursday.
Dense fog formed early this morning over the mountain valleys and Southeast Plains due to the strong radiational cooling. Overnight, Alamosa dipped to 32F, but all the other lower elevations seemed to have stayed above the freezing mark.
Ongoing Colorado wildfires update (as of 9:15AM from InciWeb):
Cameron Peak in the Medicine Bow Mountains: 102,596 acres; 4% contained
Williams Fork in the Arapaho National Forest: 12,157 acres; 10% contained
Pine Gulch north of Grand Junction: 139,007 acres; 95% contained
Grizzly Creek in Glenwood Canyon: 32,431 acres; 91% contained
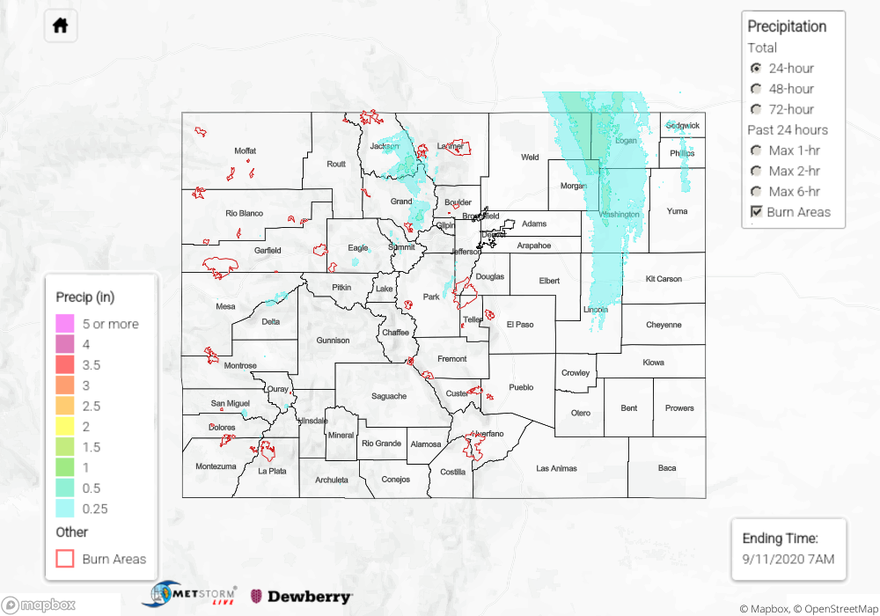
To see precipitation estimates over your area the last 24-hours and for this storm event (72-hour), scroll down to the State Precipitation Map below.
Click Here For Map Overview