SPM 07-06-2021: Flash Floods on Several Burn Scars

Issue Date: Tuesday, July 6, 2021
Issue Time: 9:45 AM MDT

Summary:

Monday saw widespread thunderstorm activity across the Northern, Central, and Southeast Mountains, as well as in the San Luis Valley. An isolated storm produced heavy rain in the Southeast Denver Metro Area in the Urban Corridor. The Southwest Slope and Grand Valley also saw measurable precipitation. Storms began to fire up in the high elevations in the early afternoon and became more widespread as the afternoon progressed, resulting in several flood warnings and advisories to be issued, especially for burn areas. These storms were very slow moving, resulting in high rainfall rates and further increasing the flood risk.

Flash flooding was reported on several burn scars across the state:

  1. Highway 125 in Grand County was closed due to flash flooding and debris flow north of Granby on the East Troublesome burn scar. CoCoRaHS observers in Granby reported 0.14-0.40 inches of rain.
  2. Further west, I-70 was briefly closed in Glenwood Canyon as a safety precaution after a flash flood warning was issued over the Grizzly Peak burn scar. Minor flow was reported under the interstate drainages, but the highway was ultimately not impacted. I-70 opened shorting after the flash flood warning was downgraded to a watch. The Glenwood Springs area only reported up to 0.13 inches of rain, which shows how sensitive this particular burn scar is.
  3. In the Grand Valley, the Pine Gulch burn scar also had flooding reported yesterday with minor debris flowing over roadways. Again, only light precipitation was reported over this burn area, between 0.01-0.10 inches in total.

Flooding was not limited to burn scars however, a flash flood was reported near 11-Mile Canyon Reservoir in Park County, which closed highway 9 at milepost 36 due to flooding. Due to the rural location, there are limited precipitation observations in the area.

Heavy rain, up to 2.25 inches in total, was reported in Westcliffe from a nearly stationary severe thunderstorm. While there are no formal flood reports, the language of the severe thunderstorm warning from the NWS indicates flooding was occurring at the time of the warning in the Wet Mountain Valley. County emergency managers reported as much as 1.5 inches of rain in as little as 30 minutes. Nearby observations from various networks reported between 0.70-1.05 inches around the area as well.

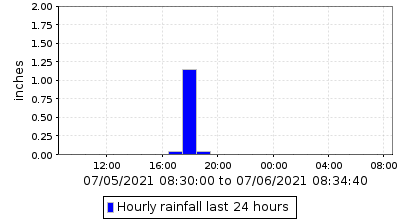
In the Urban Corridor around 4:00 pm, a cell made its way over the Southeast Denver Metro Area and produced a quick 1.0-1.7 inches of rain. Buckley Air Force Base in Aurora reported 1.69 inches. CoCoRaHS observers also in Aurora reported 1.15 inches. A MHFD rain gauge at Mission Viejo Park in Aurora reported 1.22 inches as well, with 1.14 of that falling in a single hour, as seen in the time series plot below. The heavy rain resulted in flood advisory issued for several urban streams.
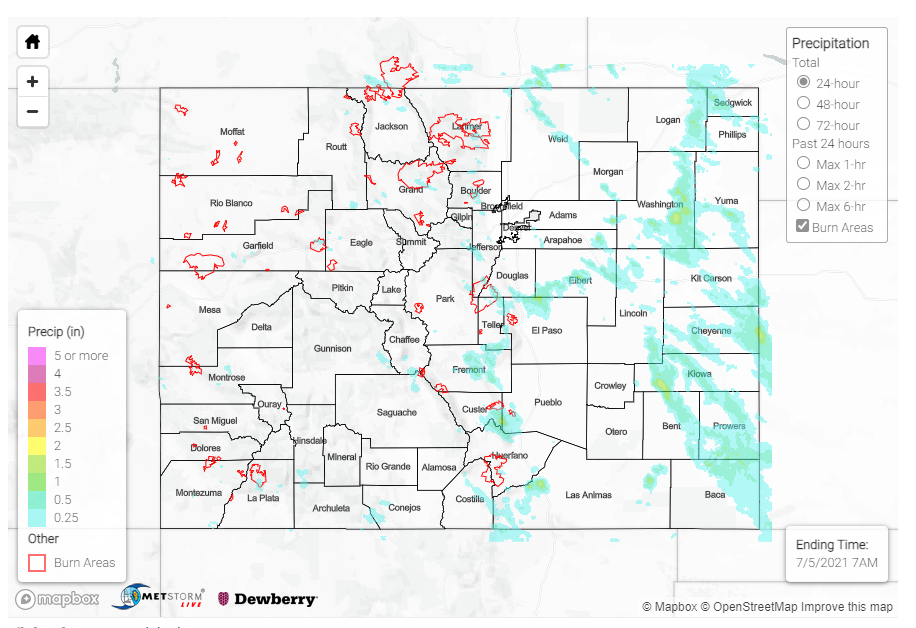
For rainfall estimates in your area, check out the State Precipitation Map below.

Click Here For Map Overview

The map below shows radar-estimated, rainfall gage-adjusted Quantitative Precipitation Estimates (QPE) across Colorado. The map is updated daily during the operational season (May 1 – Sep 30) by 11AM. The following six layers are currently available: 24-hour, 48-hour and 72-hour total precipitation, as well as maximum 1-hour, 2-hour and 6-hour precipitation over the past 24 hour period (to estimate where flash flooding may have occurred). The 24-hour, 48-hour and 72-hour total precipitation contain bias corrections that are not disaggregated into the hourly estimates, so there will likely be some differences. The accumulation ending time is 7AM of the date shown in the bottom right corner. Also shown optionally are vulnerable fire burn areas (post 2012), which are updated throughout the season to include new, vulnerable burn areas. The home button in the top left corner resets the map to the original zoom.

SPM 07-05-2021: Heavy Rainfall in High Elevations and Southeast Plains

Issue Date: Monday, July 5, 2021
Issue Time: 9:45 AM MDT

Summary:

As mentioned in the FTB yesterday, there were a few main areas of higher concern for heavy preciptiation and flooding: high elevations in the Front Range Mountains, Southeast Mountains, Palmer Ridge, and Raton Ridge; and the Southeast Plains.

By late morning, storms already began to develop at high elevations on the Front Range Mountains and Palmer Ridge, warranting flood advisories to be issued, including portions of the Cameron Peak burn area. Due to the slow-moving nature of these storms, rainfall rates were high and capable of producing quick flooding. Flooding was reported on the Cameron Peak burn scar in Glen Haven, as well as another flood report neaby in Estes Park.

As the day progressed, storms eventually made their way eastward onto Urban Corridor and further east on the Palmer Ridge. Up to 0.79 inches was reported in Lyons, and a similar 0.76 inches in nearby Longmont were reported by CoCoRaHS observers. Moving further south, between Centennial and Parker southeast of Denver, 1.18 inches was reported by a CoCoRaHS observer, and many surrounding locations reported between 0.5-1.0 inches of precipitation. Along with the heavy rainfall producing localized flooding in this area, severe-warned storms produced large hail, including 0.75 inch reported. The Colorado Springs area also saw between 0.1 to nearly 1.0 inches across town.

By late evening, storms had developed in the Southeast Mountains and Southeast Plains, with many severe thunderstorm warnings issued for high winds and large hail. Again, these storms were very slow moving and caused localizing heavy rainfall and flooding. Flooding was reported by law enforcement near Coaldale on the Hayden Pass burn area (2016 fire), indicating high waters on several creeks. The full remark is below:
Remark: SOME MUD AND ROCKS ON THE ROAD. COTTONWOOD, LITTLE COTTONWOOD, AND BIG COTTONWOOD ALL HAD HIGH WATERS REPORTED. BUTTER CREEK WAS THE ONLY ONE WITH NOTABLE FLOODING. THE WATERS HAVE ALREADY BEGUN TO RECEDE.

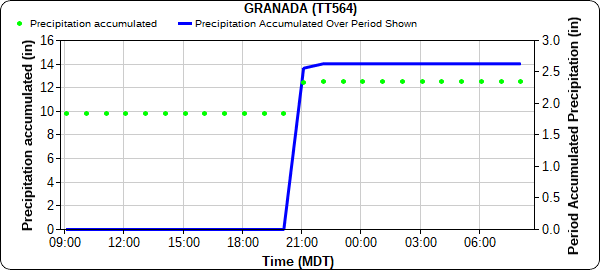
A nearly stationary cell in southeast Colorado resulted in heavy rainfall and flooding. A flash flood was reported in Lamar for street flooding, and Lamar itself picked up between 0.36-1.02 inches across town. Nearby in Granada, just east of Lamar, 2.63 inches was observed! Of that, 2.56 inches of it fell in a single hour, as seen in the time series plot below. The 1-hour (60-minute), 50-year rainfall estimate from NOAA Atlas 14 in Granada is 2.59 inches, making this storm just under a 50-year event.

Since yesterday was Independence Day, there were plenty of eyes on the sky observing the evening storms along with local fireworks shows. Matt Minnillo shared the following video on twitter of fireworks in Falcon and lightning from storms in Lamar.

For rainfall estimates in your area, check out the State Precipitation Map below.

Click Here For Map Overview
The map below shows radar-estimated, rainfall gage-adjusted Quantitative Precipitation Estimates (QPE) across Colorado. The map is updated daily during the operational season (May 1 – Sep 30) by 11AM. The following six layers are currently available: 24-hour, 48-hour and 72-hour total precipitation, as well as maximum 1-hour, 2-hour and 6-hour precipitation over the past 24 hour period (to estimate where flash flooding may have occurred). The 24-hour, 48-hour and 72-hour total precipitation contain bias corrections that are not disaggregated into the hourly estimates, so there will likely be some differences. The accumulation ending time is 7AM of the date shown in the bottom right corner. Also shown optionally are vulnerable fire burn areas (post 2012), which are updated throughout the season to include new, vulnerable burn areas. The home button in the top left corner resets the map to the original zoom.

SPM 07-04-2021: I-70 Closed Again; Active Severe Day for Eastern Plains

Issue Date: Sunday, July 4, 2021
Issue Time: 10:00 AM MDT

Summary:

Interstate-70 closed again yesterday due to mud and debris flow in Glenwood Canyon from the Grizzly Creek burn scar. A flash flood warning was issued for a portion of the burn area around 3 pm yesterday afternoon after Doppler radar indicated heavy rainfall from thunderstorms. While not a lot of rain actually fell, as seen in the State Precipitation Map at the bottom of this post, this highlights the canyon’s sensitivity to debris flows after only a small amount of rain on the burn scar. CDOT shared the following images of the Glenwood Canyon closure on twitter:

The rest of the western half of the state was mostly dry yesterday, aside from isolated, high elevation thunderstorms activity on the Western Slopes and Northern and Central mountains. On the Southwest Slope, storms produced 0.25-0.4 inch accumulations, including 0.38 inches in Durango. Storm development continued to move eastward over the Front Range Mountains, Urban Corridor, and Eastern Plains and become more organized.

On the Northeast Plains and Palmer Ridge, organized lines of thunderstorms moving southeastward extended from the northeast portion of the state on the Nebraska border all the way Colorado Springs in the early evening. Severe thunderstorm warnings and flood advisories were issued, with the threat of heavy rain, high winds, and large hail. A severe-warned cell dropped 2.00 inches in about an hour in Fleming, CO according to trained spotters, as well as 1.5 inch hail and 60 mph wind gust. Two short-lived landspout tornadoes were also spawned from rotating storms.

Heavy rain was also observed in the Wet Mountains in the Southeast Mountain. Thunderstorms dropped 1.14 inches near Cañon City according to CoCoRaHS observes, who left the following remark:
“We had a downpour from about 3:30 to 4PM yesterday that dropped over an inch of rain and caused some localized minor flooding!”

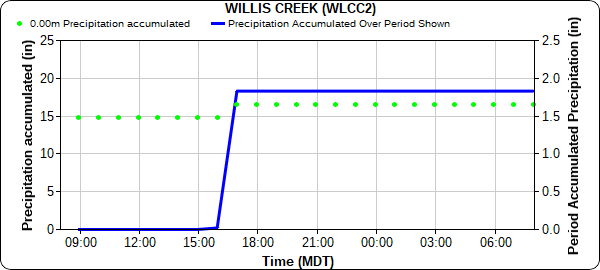
Even higher precipitation totals in the Wet Mountains: 1.44 inches was recorded in San Isabel in from a trained spotter, and 1.83 inches fell at Willis Creek and was observed by the RAWS network. The time series plot of precipitation at Willis Creek below aligns with the Cañon City remark about most of the rain falling in less than hour. Precipitation Frequency Estimates from NOAA Atlas 14 for this region indicate 1.83 inches in an hour is approximately a 17-year rainfall event (or ~6% chance of occurrence any given year).

For rainfall estimates in your area, check out the State Precipitation Map below.

Click Here For Map Overview

The map below shows radar-estimated, rainfall gage-adjusted Quantitative Precipitation Estimates (QPE) across Colorado. The map is updated daily during the operational season (May 1 – Sep 30) by 11AM. The following six layers are currently available: 24-hour, 48-hour and 72-hour total precipitation, as well as maximum 1-hour, 2-hour and 6-hour precipitation over the past 24 hour period (to estimate where flash flooding may have occurred). The 24-hour, 48-hour and 72-hour total precipitation contain bias corrections that are not disaggregated into the hourly estimates, so there will likely be some differences. The accumulation ending time is 7AM of the date shown in the bottom right corner. Also shown optionally are vulnerable fire burn areas (post 2012), which are updated throughout the season to include new, vulnerable burn areas. The home button in the top left corner resets the map to the original zoom.
Note: The 24-hour, 48-hour and 72-hour total precipitation do not contain bias corrections today due to errors in the CoCoRaHS data. This means there may be underestimations in QPE over the southwest and southeast corners of the state.

SPM 07-03-2021: Flash Flood on Spring Creek Burn Scar

Issue Date: Saturday, July 3, 2021
Issue Time: 10:00 AM MDT

Summary:

While less eventful than Thursday, Friday saw a continued push of monsoonal moisture into the state. In the early afternoon isolated storms began to develop in the Northwest and Southwest Slopes, Grand Valley, Northern and Central Mountains. Storms moved eastward and became better organized through the afternoon and evening, especially with the ample moisture available. Flood advisories and flash flood warnings were issued up and down the Front Range and Southeast Mountains, including the East Troublesome, Cameron Peak, and Spring Creek burn areas. No flooding was reported in northern Colorado for the East Troublesome and Cameron Peak scars, however there was flooding in La Veta and Walsenburg on the Spring Creek scar.

2.24 inches of rain was reported in La Veta from a CoCoRaHS observer, who also remarked:
“biggest flooding yet. all three drainages from the west AND S Middle Creek from the S. most rain came in one hour afternoon [downpour]. thunder and lightning”

The 2-hour, 25-year recurrence interval precipitation in La Veta, according to NOAA Atlas 14, is 2.23 inches. So the 2.24 observation is just over a 25-year event (or 4% chance of occurrence in any given year). Nearby in Walsenburg, an additional 1.95 inches of rain was reported.

Flash flood warnings were also issued for rural Chaffee County, which received between 0.25-0.5 inches of rainfall near Nathrop (between Buena Vista and Salida). Law enforcement there reported a flash flood of “1-3 FEET OF WATER AND MUD OVER COUNTY ROAD 162″.

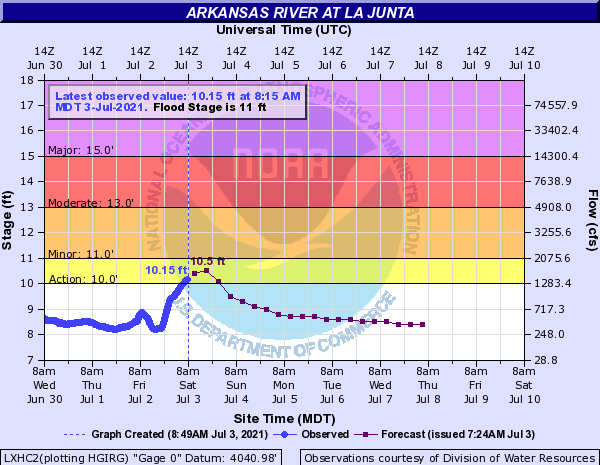
The heavy rain over the last few days in the Arkansas River basin has resulted in higher river flows. The Arkansas River at La Junta quickly rose overnight, and is currently in “Action Stage”, just over 10 feet.
Further north in the Urban Corridor, hail and localized flooding was reported in Brighton after a severe-warned thundestorm. CoCoRaHs observers reported up to 1.17 inches of rain in 24 hours, and several large hail reports were made through mPing, including a 1.25 inch report. A flood advisory was also issued for this area.

In the central mountains, 0.25 inch hail was reported on the Sylvan Fire associated with spotty shower activity and isolated 0.5 inches of rain

For rainfall estimates in your area, check out the State Precipitation Map below!

Click Here For Map Overview

The map below shows radar-estimated, rainfall gage-adjusted Quantitative Precipitation Estimates (QPE) across Colorado. The map is updated daily during the operational season (May 1 – Sep 30) by 11AM. The following six layers are currently available: 24-hour, 48-hour and 72-hour total precipitation, as well as maximum 1-hour, 2-hour and 6-hour precipitation over the past 24 hour period (to estimate where flash flooding may have occurred). The 24-hour, 48-hour and 72-hour total precipitation contain bias corrections that are not disaggregated into the hourly estimates, so there will likely be some differences. The accumulation ending time is 7AM of the date shown in the bottom right corner. Also shown optionally are vulnerable fire burn areas (post 2012), which are updated throughout the season to include new, vulnerable burn areas. The home button in the top left corner resets the map to the original zoom.
a href=”http://www.dewberry-hydromet.com/STP/Snapshots/SPM/SPM_202100703_snap.png”>