SPM 06-11-2022: Hot Friday

Issue Date: Saturday, June 11th, 2022
Issue Time: 11:00 AM MDT

Summary:

Friday saw sunshine and much above normal temperatures, as an upper-level ridge centered over the desert southwest expanded northeastward across the state. Temperatures approached and exceeded triple digits in some locations, with Grand Junction airport tying their record high of 100 degrees set in 1981.

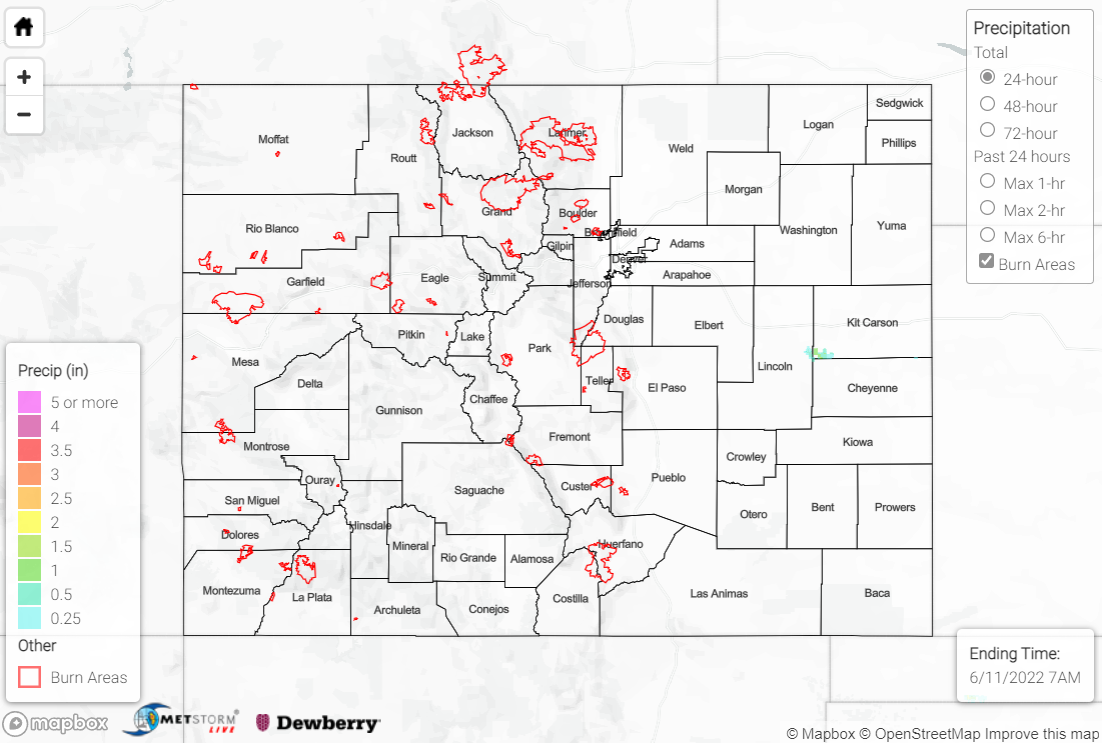
Thanks to subsidence under the building ridge, Colorado was precipitation-free on Friday, with only isolated reports of a trace to a couple hundredths of an inch.

The Boulder WFO issued a Flood Advisory for snowmelt yesterday for the upper reaches of the Colorado River in Grand County that remains in effect until 6:45 AM MDT Monday. The river is expected to rise to 7.8 feet, with flood stage being 8.0 feet. Minor lowland and meadow flooding is expected from near the entrance of Rocky Mountain National Park down to Grand Lake. Numerous other creeks, streams, and rivers in the high country are also observing above normal flows due to snowmelt.

There was no flooding reported yesterday. For precipitation estimates in your area, check out the map below.
Click Here For Map Overview

The map below shows radar-estimated, rainfall gage-adjusted Quantitative Precipitation Estimates (QPE) across Colorado. The map is updated daily during the operational season (May 1 – Sep 30) by 11AM. The following six layers are currently available: 24-hour, 48-hour and 72-hour total precipitation, as well as maximum 1-hour, 2-hour and 6-hour precipitation over the past 24 hour period (to estimate where flash flooding may have occurred). The accumulation ending time is 7AM of the date shown in the bottom right corner. Also shown optionally are vulnerable fire burn areas (post 2012), which are updated throughout the season to include new, vulnerable burn areas. The home button in the top left corner resets the map to the original zoom.

SPM 06-10-2022: Storms in the South and East, Dry Weather Continues

Issue Date: Friday, June 10th, 2022
Issue Time: 9:45 AM MDT

Summary:

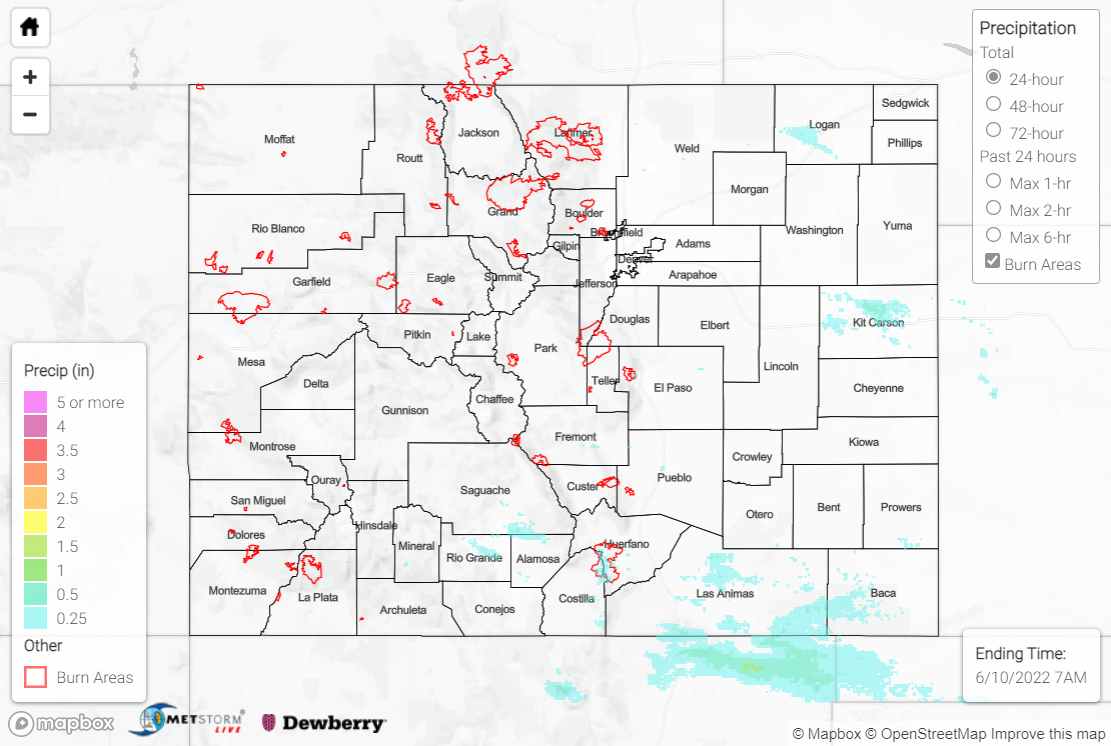
Yesterday saw relatively dry conditions across the state, with only light amounts of precipitation in most areas. The Front Range received a small amount of rainfall, with Denver reports ranging from 0-0.02”, and the Colorado Springs area recording up to 0.07”. Pueblo and south-central Colorado received some sparse rainfall as well, most notably 0.10” in Pueblo and 0.15” near Great Sand Dunes.

Two severe thunderstorm warnings were issued yesterday afternoon, just east of I-25 near the southern border of the state. However, the warnings were brief, spanning less than an hour each. In the central plains near the eastern border, two more severe thunderstorm warnings were issued a bit later in the evening. These areas received higher levels of rainfall, reporting 0.25” and 0.27” in Stratton and 0.21” north of Burlington. Lastly, the northeast corner of the state also had some storm activity yesterday- reports came in from Logan County, CO of 0.25-1.25″ hail and up to 0.21” of rainfall in Sterling.

Up in the mountains, two stream gages are recording all-time highs for this day of the year, at Cross Creek near Minturn and Joe Wright Creek above Joe Wright Reservoir. However, most streams in this area are at or slightly above normal and none are above flood stage. There was no flooding reported yesterday. For precipitation estimates in your area, check out the map below.
Click Here For Map Overview

The map below shows radar-estimated, rainfall gage-adjusted Quantitative Precipitation Estimates (QPE) across Colorado. The map is updated daily during the operational season (May 1 – Sep 30) by 11AM. The following six layers are currently available: 24-hour, 48-hour and 72-hour total precipitation, as well as maximum 1-hour, 2-hour and 6-hour precipitation over the past 24 hour period (to estimate where flash flooding may have occurred). The accumulation ending time is 7AM of the date shown in the bottom right corner. Also shown optionally are vulnerable fire burn areas (post 2012), which are updated throughout the season to include new, vulnerable burn areas. The home button in the top left corner resets the map to the original zoom.

SPM 06-09-2022: Storms for Raton Ridge, Rest of State Dries Out

Issue Date: Thursday, June 9th, 2022
Issue Time: 10:15 AM MDT

Summary:

A cooler and more stable air mass pushed south through Colorado behind a cold front early Wednesday morning, while upper-level height rises and weak ridging aloft granted much of the state a welcome respite from the storms and severe weather of late.

Appreciable moisture and instability were shunted well south of U.S. Highway 50, where a few showers and storms developed late in the evening along the Raton Ridge thanks to a weak disturbance passing overhead. The showers and storms moved off the Ridge and out across the southern Southeast Plains before weakening and finally dissipating after midnight. Precipitation totals were generally 0.25-0.50”, with a few locally higher amounts with the more intense storms. No severe weather was reported.

North of Highway 50 and west of the Divide, dry conditions dominated through the day yesterday and into the overnight period. Early this morning, a weak shortwave passing through the northern Rockies provided enough lift to spark some light showers across the Northern Mountains and northern Front Range, with T-0.25” reported from this morning’s precipitation.

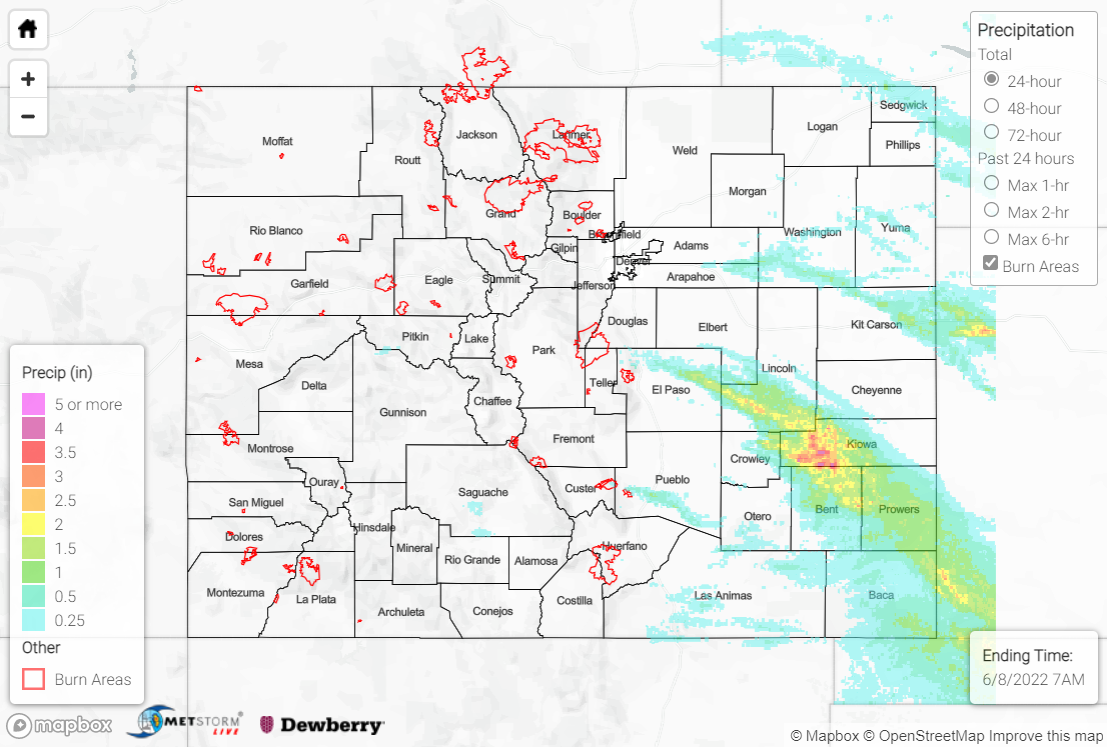
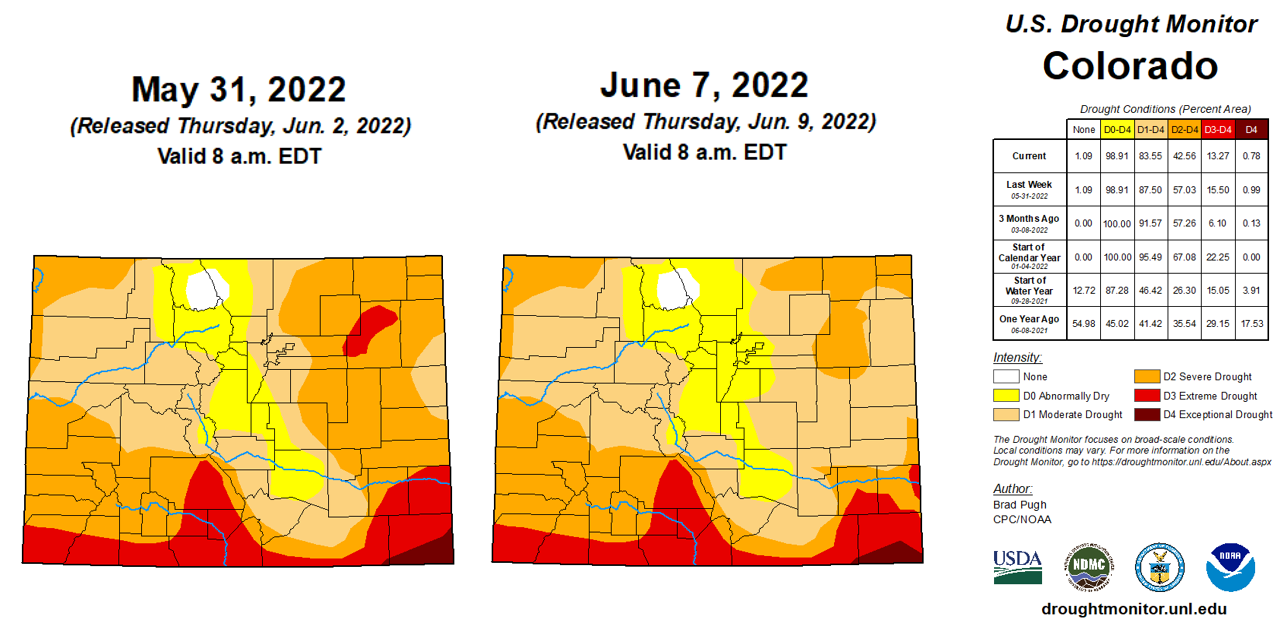
The updated U.S. Drought Monitor was released this morning, with another week of improvements across the state. Most notable was a significant reduction in severe and extreme drought conditions across portions of the Palmer Ridge and Northeast Plains. Statewide, percent coverage dropped 2.2% for extreme drought, 14.5% for severe drought, and 4% for moderate drought.

Flow on the Arkansas River near Lamar is on a decreasing trend after the heavy rainfall the past few days. There was no flooding reported yesterday. For precipitation estimates in your area, check out the map below.
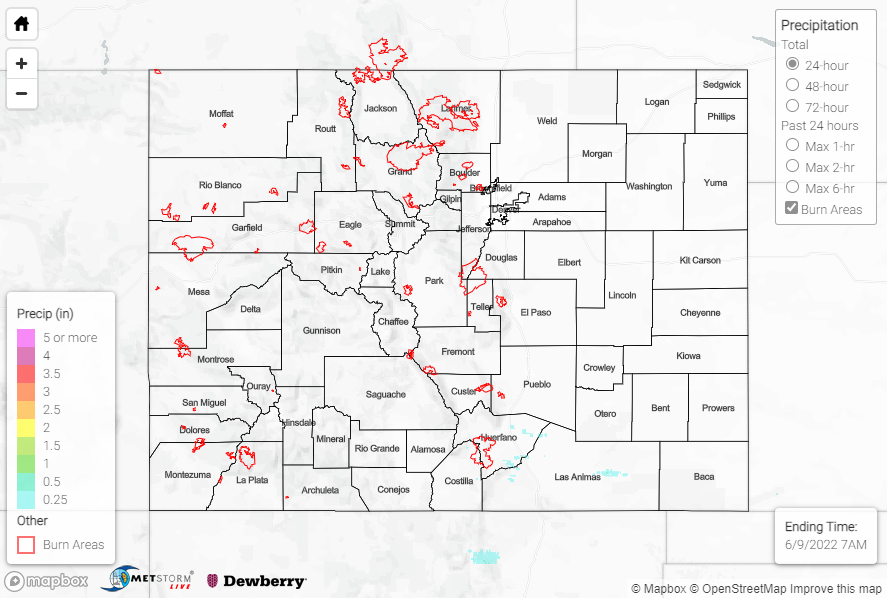
Click Here For Map Overview

The map below shows radar-estimated, rainfall gage-adjusted Quantitative Precipitation Estimates (QPE) across Colorado. The map is updated daily during the operational season (May 1 – Sep 30) by 11AM. The following six layers are currently available: 24-hour, 48-hour and 72-hour total precipitation, as well as maximum 1-hour, 2-hour and 6-hour precipitation over the past 24 hour period (to estimate where flash flooding may have occurred). The accumulation ending time is 7AM of the date shown in the bottom right corner. Also shown optionally are vulnerable fire burn areas (post 2012), which are updated throughout the season to include new, vulnerable burn areas. The home button in the top left corner resets the map to the original zoom.

SPM 06-08-2022: Another Day, Another Round of Severe Weather

Issue Date: Wednesday, June 8th, 2022
Issue Time: 11:15 AM MDT

Summary:

Tuesday was nearly a carbon copy of Monday, as Colorado saw another day of severe weather and heavy rainfall east of the Divide. The axis of the main upper trough responsible for our weather over the last several days passed across the northern Rockies, while an impressive 110 knot jet max progressed from southern Idaho into southern Wyoming during the day. At the surface, broad southeasterly upslope flow led to better moisture and instability compared to Monday, with appreciable moisture reaching as far west as I-25.

A combination of afternoon heating and upper-level energy associated with the wave to our north led to convective initiation by mid-afternoon on the high terrain of the Palmer and Raton Ridges. Environmental parameters favored discrete supercells with this initial round of convection, and storms quickly moved off the high terrain and into the Northeast and Southeast Plains. A secondary round of convection developed later in the evening along the Palmer Ridge before moving into the Southeast Plains; this secondary wave of convection traveled over many of the same areas while growing upscale into a line.

Storms and their associated precipitation were confined to the Northeast Plains, far-southern Urban Corridor, Palmer Ridge, and Southeast Plains, where amounts of 0.50-1.00” were generally observed wherever storms passed. The exception was across southern Lincoln County southeastward into western Kiowa County and Bent and Prowers Counties. In this swath where storms repeatedly passed, the heaviest precipitation in the state was observed, with amounts of 2-3” and localized totals approaching 4+”, per QPE data. Observations are sparse, but some noteworthy reports in this region include:

• 3.00” 3 miles SW of Lamar
• 2.25” 3 miles S of Lamar
• 2.23” at Lamar Municipal Airport

The Pueblo WFO issued another Flash Flood Warning for west-central Prowers County as well as east-central Bent County, including the towns of Lamar, Granada, and Hasty. Local law enforcement reported Main Street in Lamar under 1-2 feet of water! An automated station 3 miles SW of Lamar record 0.98” of rain in just 20 minutes; with rainfall rates of this magnitude, combined with Monday’s rainfall, it does not come as a surprise that flash flooding was observed. The Arkansas River at Lamar is not currently in flood stage, but a sharp rise was observed overnight:

Tuesday saw more intense severe weather than Monday, with 8 tornado reports, 50 hail reports, and 6 wind reports across the state. Of the hail reports, 10 were for significant hail (2+”), including a report of 3.5” hail (nearly softball-sized) 15 miles ENE of Two Buttes! Of the wind reports, 2 were for significant wind (75+ mph), including an 85-mph thunderstorm wind gust 5 miles S of Burlington. The tornado reports were for landspouts in the far northeast corner of the state, and for tornadoes associated with the supercells across the Southeast Plains near Lamar.

The only flooding reported statewide yesterday was in Lamar. For precipitation estimates in your area, check out the map below.

Click Here For Map Overview

The map below shows radar-estimated, rainfall gage-adjusted Quantitative Precipitation Estimates (QPE) across Colorado. The map is updated daily during the operational season (May 1 – Sep 30) by 11AM. The following six layers are currently available: 24-hour, 48-hour and 72-hour total precipitation, as well as maximum 1-hour, 2-hour and 6-hour precipitation over the past 24 hour period (to estimate where flash flooding may have occurred). The accumulation ending time is 7AM of the date shown in the bottom right corner. Also shown optionally are vulnerable fire burn areas (post 2012), which are updated throughout the season to include new, vulnerable burn areas. The home button in the top left corner resets the map to the original zoom.