SPM 07-13-2022: Increased Coverage of Showers and Storms

Issue Date: Wednesday, July 13th, 2022
Issue Time: 10:45 AM MDT

Summary:

Although the upper-level ridge over Colorado weakened and progressed slightly southward on Tuesday, the day started with sunshine and temperatures remained a few degrees above normal for most locations. Typical diurnal thunderstorm development in the mountains occurred by early afternoon, while a shortwave traversing the state on increasingly northerly flow aloft expanded shower and storm coverage by mid-afternoon into the foothills and eventually the eastern Plains. Lee cyclogenesis and a surface high to our east provided moisture return and upslope flow near the surface, further aiding convective development. Sufficient shear (around 30 knots) allowed enough storm organization to lead to numerous Severe Thunderstorm Warnings, with hail and heavy rain the primary threats.

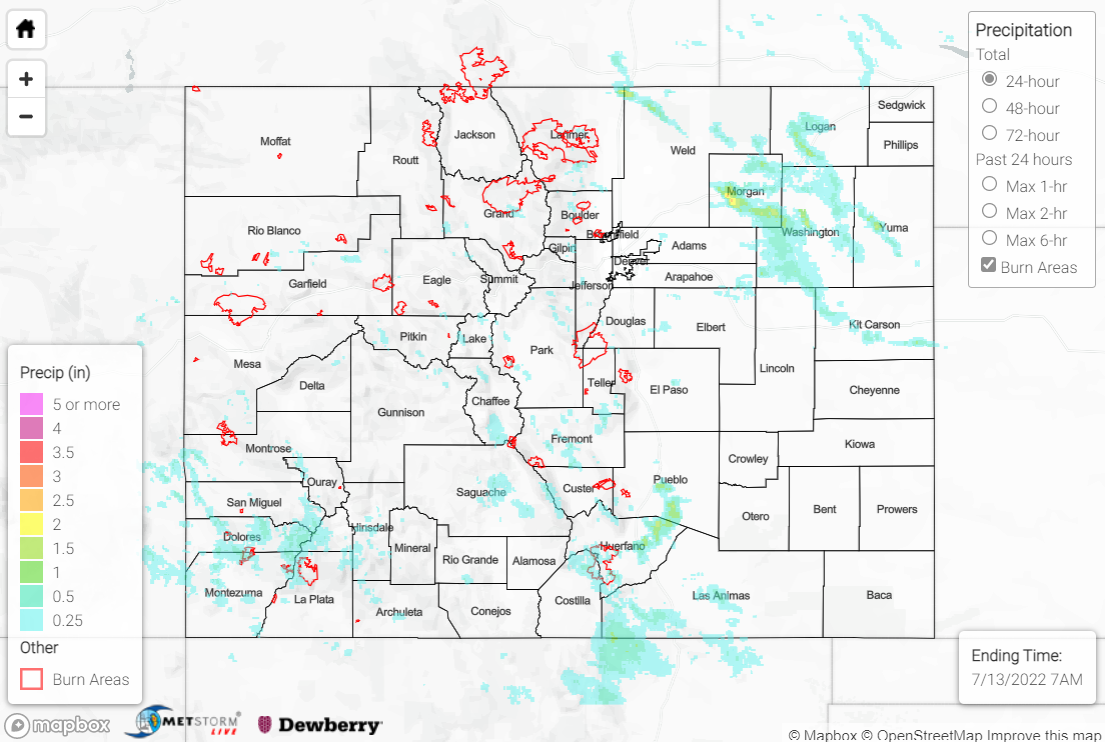
The heaviest rain occurred across the Northeast Plains along and southeast of the I-76 corridor, where amounts up to 1-2” were observed. Gauge observations are sparse, but CoCoRaHS observers reported 0.89” and 0.60” near Woodrow and Flagler, respectively. 1-1.5” hail was also reported in this region. The Southeast Mountains and Raton Ridge also saw heavy rainfall, with amounts of 0.5-1.5”. An automated station near La Veta measured 1.07”, while a CoCoRaHS observer near Walsenburg measured 0.73”. Up to 1.75” hail was reported near Trinidad, with a CoCoRaHS observer reporting minor street flooding 1 mile west of town.

Elsewhere in the state, the Front Range generally saw T-0.25”, although some higher amounts up to 0.50” were observed, including 0.42” south of Fort Collins. The Southwest Slope observed up to 1” of rainfall, with an automated station near Towaoc measuring 0.89”.

Flash Flood Warnings were issued for south-central Chaffee County and once again the Spring Creek burn scar, with no flooding reported. Two Flood Advisories were issued for portions of the Southwest Slope, and another Flood Advisory was issued for southeastern portions of the Cameron Peak burn scar, but no flooding was reported at any of these locations.

On the interesting side of yesterday’s weather, a heat burst was recorded near Wray:

Also check out this awesome video from one of the storms in the Northeast Plains at sunset:

If you observe flooding in your area, remember to use the “Report a Flood” page to make any flood reports when you can safely do so. For precipitation estimates in our area, check out the map below.
Click Here For Map Overview

The map below shows radar-estimated, rainfall gage-adjusted Quantitative Precipitation Estimates (QPE) across Colorado. The map is updated daily during the operational season (May 1 – Sep 30) by 11AM. The following six layers are currently available: 24-hour, 48-hour and 72-hour total precipitation, as well as maximum 1-hour, 2-hour and 6-hour precipitation over the past 24 hour period (to estimate where flash flooding may have occurred). The accumulation ending time is 7AM of the date shown in the bottom right corner. Also shown optionally are vulnerable fire burn areas (post 2012), which are updated throughout the season to include new, vulnerable burn areas. The home button in the top left corner resets the map to the original zoom.

SPM 07-12-2022: Heavy Rain for Southeast Mountains, Raton Ridge

Issue Date: Tuesday, July 12th, 2022
Issue Time: 10:45 AM MDT

Summary:

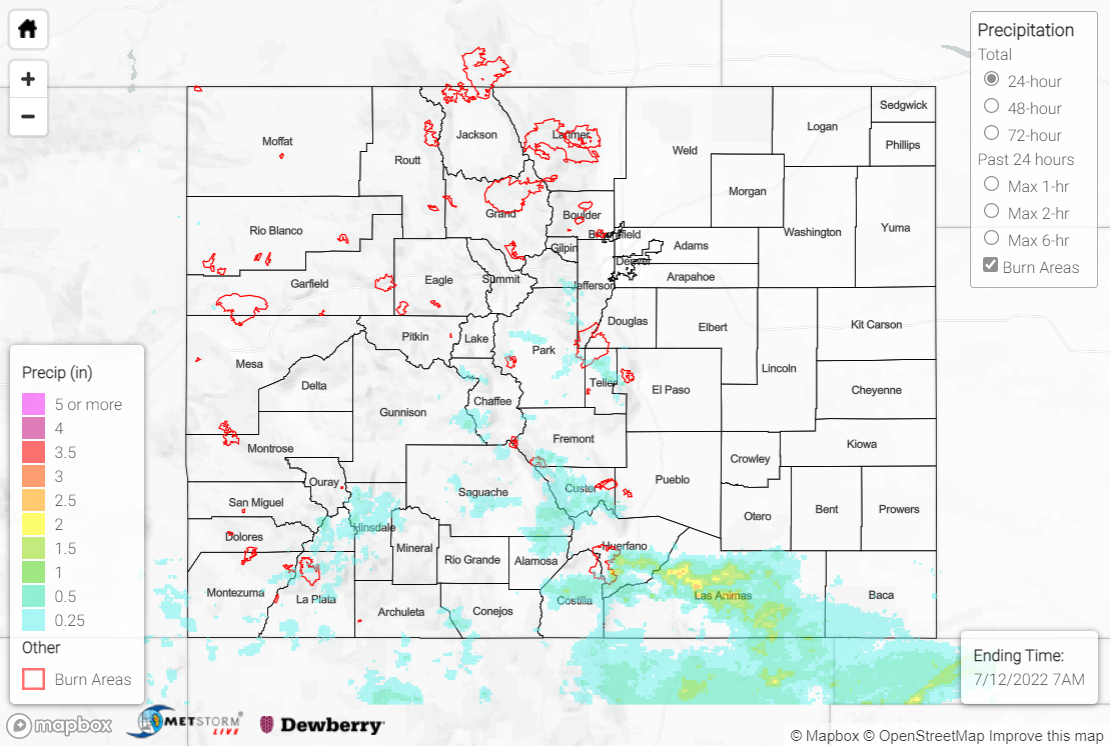
A cold front swept across the state Monday morning, shunting moisture and instability southward toward the New Mexico border. The stable post-frontal airmass precluded precipitation across the Plains and lower elevations, but storms were able to develop by mid-afternoon in the high terrain over and near the Sangre de Cristo Mountains. Storms remained confined to high elevations, with up to 1” of rain falling across portions of the southern Front Range (as far north as Pikes Peak), while 1-2” of rain (and localized amounts of 3+”) were observed across the Southeast Mountains and Raton Ridge.

Some of the storms across the Southeast Mountains and Raton Ridge produced extremely heavy rainfall rates. Flash Flood Warnings were issued for portions of central/south-central/southeast Huerfano, western Las Animas, and east-central Costilla Counties, including most of the Spring Creek burn scar. Emergency management personnel reported flash flooding along Highway 12 near mile marker 13, with the road closed due to water covering the highway; no debris flows were reported, however. The Indian Creek rain gauge on the burn scar measured 3.16” of rain in 54 minutes, which has an estimated ARI of over 1000 years! A mesonet station near La Veta measured 1.53”, while a CoCoRaHS observer near Walsenburg reported 1.30”.

Another Flash Flood Warning was issued for portions of southwest Fremont and northeast Saguache Counties, including portions of the Hayden Pass burn scar from 2016. Emergency managers reported mud and debris flowing across County Road 40 at Dinkle Ditch.

West of the Divide and south of I-70, storms were highly isolated and amounts were light (T-0.25″). One cell south of Telluride prompted a Flash Flood Warning for portions of northwest San Juan and eastern San Miguel Counties, but no flooding was reported.

If you observe flooding in your area, remember to use the “Report a Flood” page to make any flood reports when you can safely do so. For precipitation estimates in our area, check out the map below.
Click Here For Map Overview

The map below shows radar-estimated, rainfall gage-adjusted Quantitative Precipitation Estimates (QPE) across Colorado. The map is updated daily during the operational season (May 1 – Sep 30) by 11AM. The following six layers are currently available: 24-hour, 48-hour and 72-hour total precipitation, as well as maximum 1-hour, 2-hour and 6-hour precipitation over the past 24 hour period (to estimate where flash flooding may have occurred). The accumulation ending time is 7AM of the date shown in the bottom right corner. Also shown optionally are vulnerable fire burn areas (post 2012), which are updated throughout the season to include new, vulnerable burn areas. The home button in the top left corner resets the map to the original zoom.

SPM 07-11-2022: Continued Heat, Storms for the High Terrain

Issue Date: Monday, July 11th, 2022
Issue Time: 10:30 AM MDT

Summary:

Sunday featured another day of hot temperatures across the state with the upper-level ridge centered over southeast Colorado. Several record highs were broken again, including at Pueblo which reached 107 degrees! Subtropical moisture increased overhead on southwest flow aloft, with precipitable water values noticeably higher than Saturday.

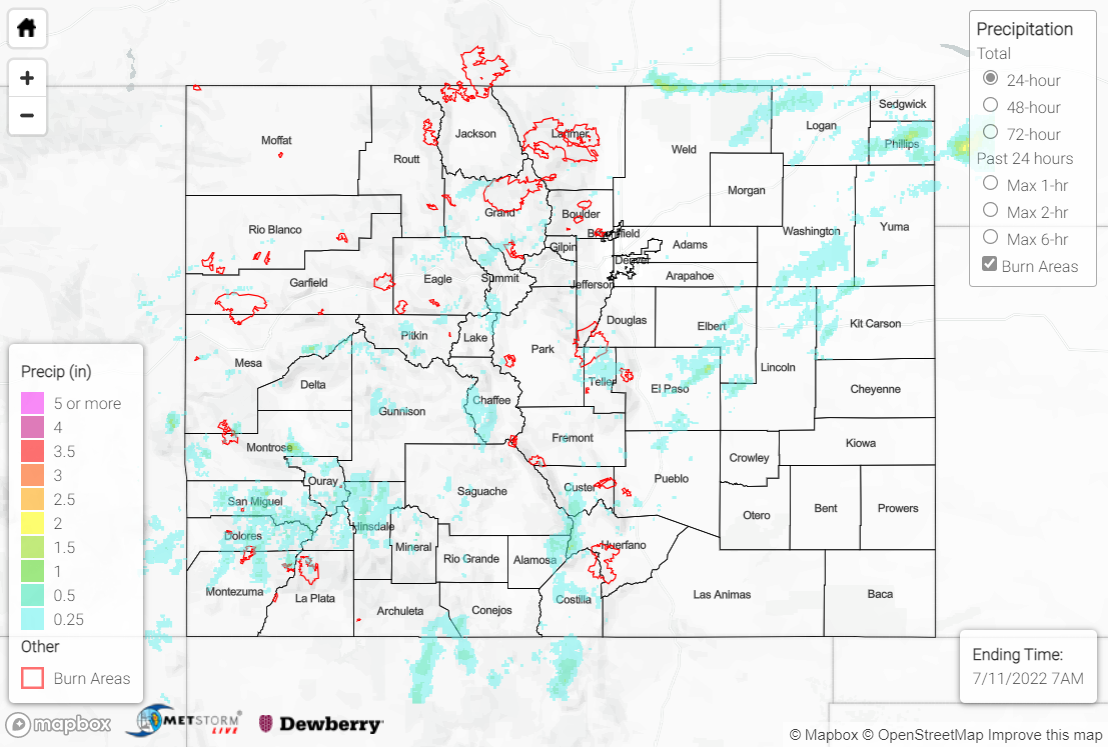
Showers and storms developed by mid-day over the high terrain, with most activity initially confined to the mountains and interior valleys west of I-25. As the day progressed, widely scattered activity was able to push into the I-25 corridor, Palmer Ridge, and portions of the Plains, with development aided by a number of subtle boundaries across the state.

Most locations that experienced precipitation saw under a quarter of an inch, while isolated totals up to 1-1.5” were observed under the most intense cells in the high terrain and northern Northeast Plains. A Flash Flood Warning was issued for north-central Ouray County, with multiple reports of flash flooding. Local law enforcement reported County Road 4 washed out, with up to 3 feet of running water covering other county roads. Several CoCoRaHS stations in the area also mentioned minor flooding, with a gauge 2.4 miles NNW of Ridgway recording 0.93”. A Flood Advisory was issued for Montrose County, although no flooding was reported.

In terms of severe weather, a cell near Colorado Springs produced a 66-mph gust at the Colorado Springs Airport. Golf ball-sized hail was reported in the Northeast Plains north of Sterling, while small hail was reported with the cell that caused the flooding in Ouray County.

For precipitation estimates in our area, check out the map below.
Click Here For Map Overview

The map below shows radar-estimated, rainfall gage-adjusted Quantitative Precipitation Estimates (QPE) across Colorado. The map is updated daily during the operational season (May 1 – Sep 30) by 11AM. The following six layers are currently available: 24-hour, 48-hour and 72-hour total precipitation, as well as maximum 1-hour, 2-hour and 6-hour precipitation over the past 24 hour period (to estimate where flash flooding may have occurred). The accumulation ending time is 7AM of the date shown in the bottom right corner. Also shown optionally are vulnerable fire burn areas (post 2012), which are updated throughout the season to include new, vulnerable burn areas. The home button in the top left corner resets the map to the original zoom.

SPM 07-10-2022: Hot Saturday

Issue Date: Sunday, July 10th, 2022
Issue Time: 10:30 AM MDT

Summary:

Ridging aloft and high pressure at the surface dominated the weather across Colorado on Saturday, with much above average temperatures and plenty of sunshine. Precipitable water values continued their downward trend of late, with the vast majority of the state staying dry. Denver and Colorado Springs broke record high temperatures, while Boulder and Colorado Springs tied record high temperatures.

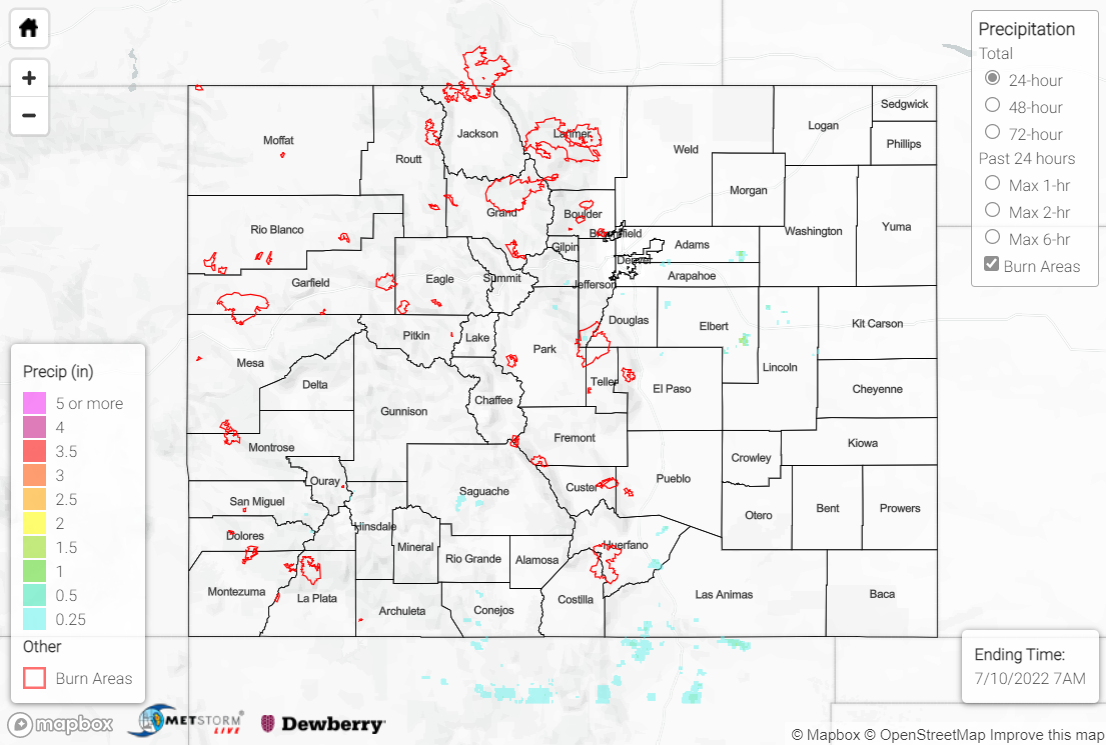
With diurnal heating, a few isolated showers and weak thunderstorms were able to pop up over the high terrain and into the I-25 corridor. Locations that experienced rain generally received 0.25” or less, although some highly localized amounts up to 0.50” were observed under the most intense cells.

No flooding was reported yesterday. For precipitation estimates in our area, check out the map below.

Click Here For Map Overview

The map below shows radar-estimated, rainfall gage-adjusted Quantitative Precipitation Estimates (QPE) across Colorado. The map is updated daily during the operational season (May 1 – Sep 30) by 11AM. The following six layers are currently available: 24-hour, 48-hour and 72-hour total precipitation, as well as maximum 1-hour, 2-hour and 6-hour precipitation over the past 24 hour period (to estimate where flash flooding may have occurred). The accumulation ending time is 7AM of the date shown in the bottom right corner. Also shown optionally are vulnerable fire burn areas (post 2012), which are updated throughout the season to include new, vulnerable burn areas. The home button in the top left corner resets the map to the original zoom.