Issue Date: Monday, July 11th, 2022
Issue Time: 10:30 AM MDT
Summary:
Sunday featured another day of hot temperatures across the state with the upper-level ridge centered over southeast Colorado. Several record highs were broken again, including at Pueblo which reached 107 degrees! Subtropical moisture increased overhead on southwest flow aloft, with precipitable water values noticeably higher than Saturday.
Showers and storms developed by mid-day over the high terrain, with most activity initially confined to the mountains and interior valleys west of I-25. As the day progressed, widely scattered activity was able to push into the I-25 corridor, Palmer Ridge, and portions of the Plains, with development aided by a number of subtle boundaries across the state.
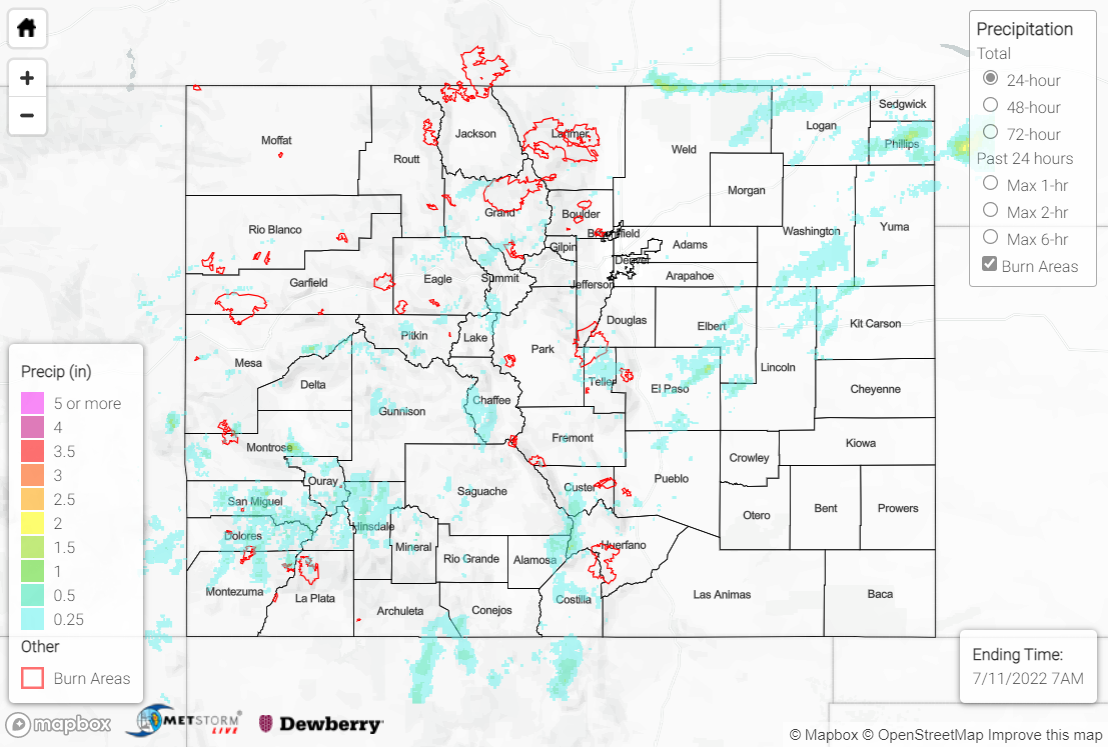
Most locations that experienced precipitation saw under a quarter of an inch, while isolated totals up to 1-1.5” were observed under the most intense cells in the high terrain and northern Northeast Plains. A Flash Flood Warning was issued for north-central Ouray County, with multiple reports of flash flooding. Local law enforcement reported County Road 4 washed out, with up to 3 feet of running water covering other county roads. Several CoCoRaHS stations in the area also mentioned minor flooding, with a gauge 2.4 miles NNW of Ridgway recording 0.93”. A Flood Advisory was issued for Montrose County, although no flooding was reported.
In terms of severe weather, a cell near Colorado Springs produced a 66-mph gust at the Colorado Springs Airport. Golf ball-sized hail was reported in the Northeast Plains north of Sterling, while small hail was reported with the cell that caused the flooding in Ouray County.
For precipitation estimates in our area, check out the map below.
