SPM 07-21-2022: More Heat, Showers and Storms

Issue Date: Thursday, July 21th, 2022
Issue Time: 11:15 AM MDT

Summary:

The weather across Colorado has been a broken record the last few days, and Wednesday was no exception. With the upper-level ridge remaining parked to our south, recycled monsoonal moisture continues to linger over the state, fueling daily rain chances. Showers and storms developed yesterday by late morning over the mountains and initially hugged the high terrain, before moving into the foothills and Plains later in the day as instability built at lower elevations. Upslope flow and diurnal heating, along with colliding outflow boundaries from collapsing storms, helped to initiate and maintain convection, while brief heavy rain, lightning, and gusty winds were the main severe weather threats. One report of 0.5” hail was received near Gypsum, while a mesonet station near Fort Carson measured a 58-mph gust. Temperatures remained above normal and hot for most of the state.

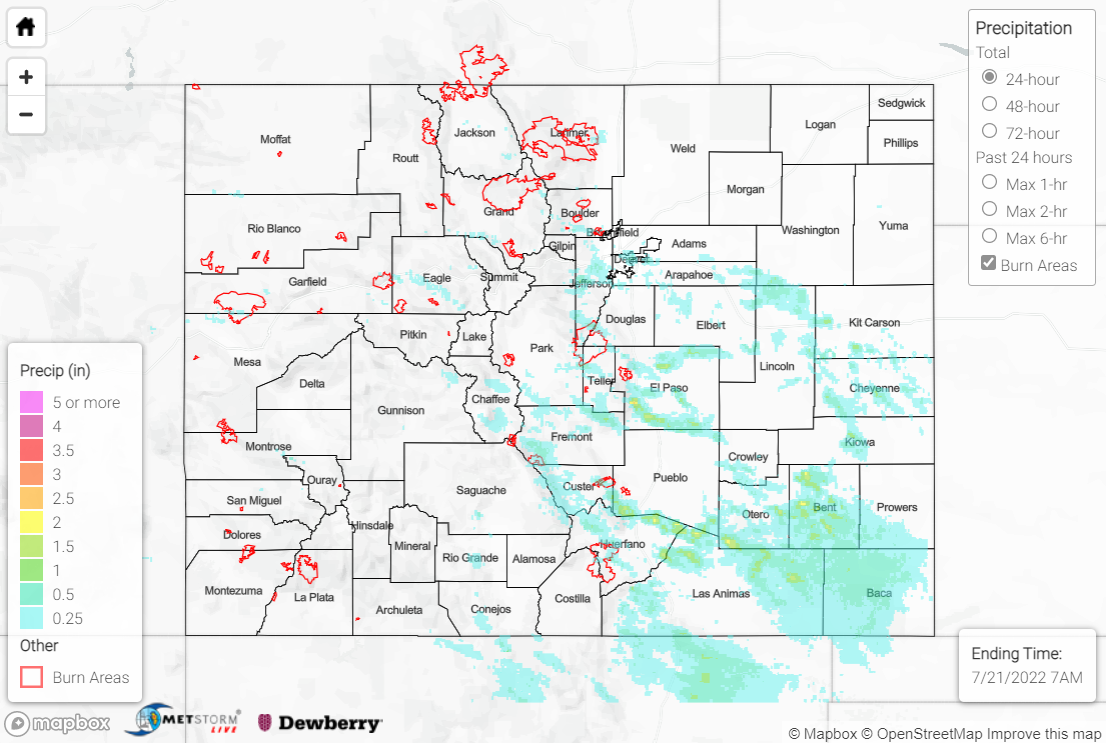
The heaviest rain fell in a swath from the southern Front Range/Urban Corridor southeastward across the Palmer Ridge and out into the western Southeast Plains. Here, QPE data suggests 0.50-1.50” of rainfall was observed under storms, with localized amounts exceeding 2”. Some noteworthy observations include:

• 1.21” at an automated station west of Fort Carson (at nearly 9500’ elevation!)
• 1.05” from a National Weather Service employee near Rye
• 1.04” from a CoCoRaHS observer near Colorado City
• 0.98” from a CoCoRaHS observer near Calhan

Farther north and west from the above swath, amounts were lighter, with locations that saw rainfall generally recording 0.30-0.60” or less. Flash Flood Warnings were issued for the Williams Fork burn scar, the Lake Christine burn scar (2018 fire), the Junkins burn scar (2016 fire), and south-central El Paso/northern Pueblo Counties, but no flooding was reported at any of these locations. Flood Advisories were also issued for a few locations, but again no flooding was reported.

If you observe flooding in your area, remember to use the “Report a Flood” page to make any flood reports when you can safely do so. For precipitation estimates in our area, check out the map below.
Click Here For Map Overview

The map below shows radar-estimated, rainfall gage-adjusted Quantitative Precipitation Estimates (QPE) across Colorado. The map is updated daily during the operational season (May 1 – Sep 30) by 11AM. The following six layers are currently available: 24-hour, 48-hour and 72-hour total precipitation, as well as maximum 1-hour, 2-hour and 6-hour precipitation over the past 24 hour period (to estimate where flash flooding may have occurred). The accumulation ending time is 7AM of the date shown in the bottom right corner. Also shown optionally are vulnerable fire burn areas (post 2012), which are updated throughout the season to include new, vulnerable burn areas. The home button in the top left corner resets the map to the original zoom.

SPM 07-20-2022: Heat and High Terrain Rain

Issue Date: Wednesday, July 20th, 2022
Issue Time: 11:15 AM MDT

Summary:

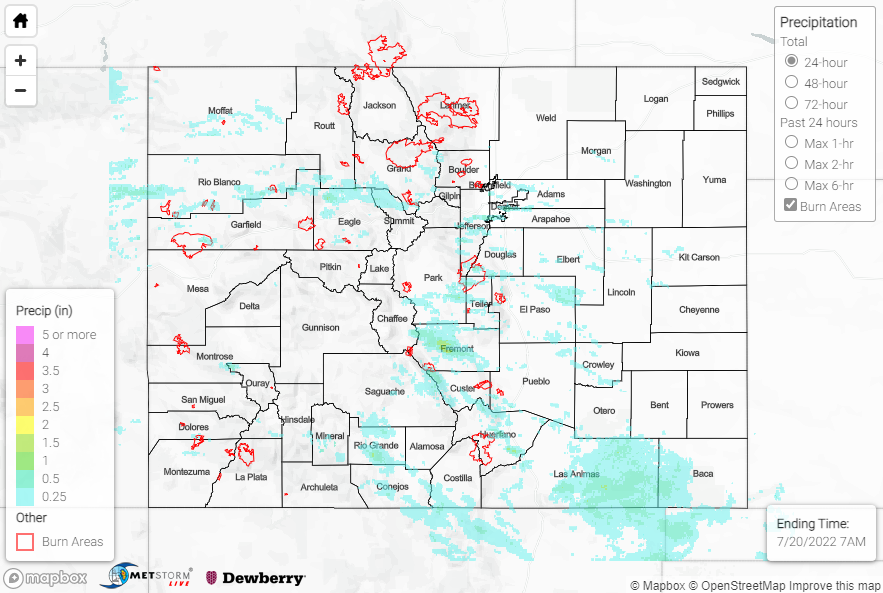
Upper-level ridging remained anchored over the Four Corners region on Tuesday, with hot temperatures and monsoonal moisture return continuing across the state. Orographic lift and diurnal heating combined to produce isolated to scattered showers and storms across the high terrain by early afternoon, with inverted-V soundings again signaling the main severe threat to be gusty outflow winds. Dry air infringing on northern portions of Colorado limited most precipitation to the mountains and foothills along and south of I-70. 45-55 mph gusts were reported with some storms, but no other severe weather reports were received. A Flash Flood Warning was issued for eastern portions of the Pine Gulch burn scar, but no flooding was reported.

Along the southern half of the Front Range and Urban Corridor, amounts generally ranged from 0.20-0.40” where precipitation was observed. Further south from southern portions of the Palmer Ridge across the Southeast Mountains and into the San Juans, isolated amounts of 0.50-1.00” were observed. An automated gauge near Walsenburg measured 0.59”, while CoCoRaHS observers near Walsenburg and Monte Vista measured 0.55” and 0.51”, respectively. Across the southern half of the Northwest Slope and Northern Mountains, gauge observations are sparse but QPE data suggests amounts up to 0.50” were observed. Up to 0.50″ was also observed across southern portions of the Southeast Plains and into the Raton Ridge.

No flooding was reported yesterday. For precipitation estimates in our area, check out the map below.
Click Here For Map Overview

The map below shows radar-estimated, rainfall gage-adjusted Quantitative Precipitation Estimates (QPE) across Colorado. The map is updated daily during the operational season (May 1 – Sep 30) by 11AM. The following six layers are currently available: 24-hour, 48-hour and 72-hour total precipitation, as well as maximum 1-hour, 2-hour and 6-hour precipitation over the past 24 hour period (to estimate where flash flooding may have occurred). The accumulation ending time is 7AM of the date shown in the bottom right corner. Also shown optionally are vulnerable fire burn areas (post 2012), which are updated throughout the season to include new, vulnerable burn areas. The home button in the top left corner resets the map to the original zoom.

SPM 07-19-2022: Record-Breaking Heat, Widely Scattered Convection

Issue Date: Tuesday, July 19th, 2022
Issue Time: 10:45 AM MDT

Summary:

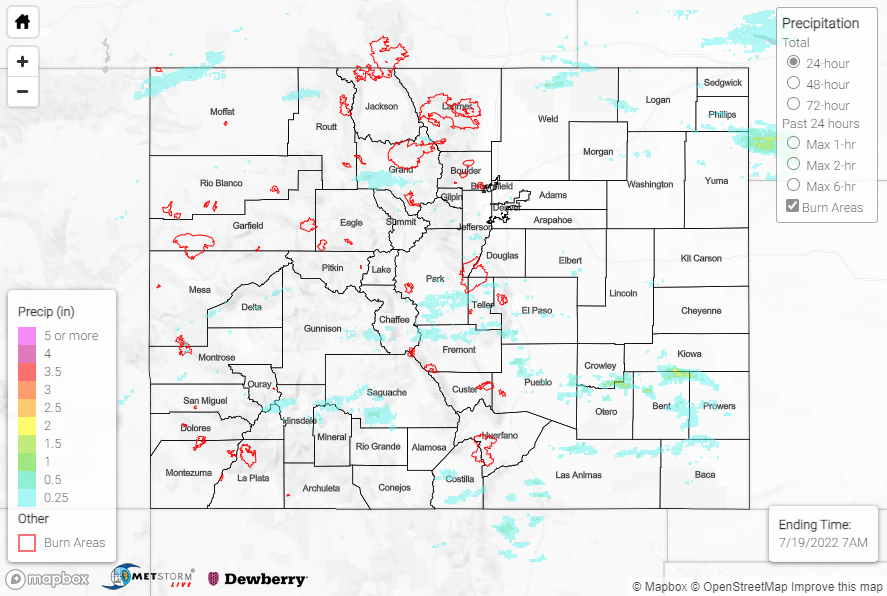
High pressure shifted southward on Monday as deep westerly flow overspread most of Colorado. The record-breaking heat continued, with Akron, Limon, and Denver setting new record high temperatures. Orographic lift and a weak wave aloft led to isolated to widely scattered showers and storms developing over the interior mountains and valleys by the afternoon, although convection struggled to move off the high terrain and into the Plains. Moisture was mainly confined to the mid-levels with inverted-V soundings present, limiting the threats with any storms to gusty outflow winds and brief heavy rainfall. A 70-mph gust was reported near Peterson Air Force Base, while outflow winds gusted over 50 mph at Pueblo Airport. 1.25” hail was reported near Trinidad.

Rainfall amounts over the high terrain and foothills were generally 0.25-0.50”, but up to 0.81” was measured just west of Colorado Springs. The heaviest rainfall fell across the Southeast Plains, where QPE data suggests localized amounts exceeding 1.50” occurred along the U.S. Highway 50 corridor. Gauge observations in this vicinity are sparse, but CoCoRaHS observers reported 1.03” and 0.65” just north of La Junta and Lamar, respectively.

Additionally, a heat burst occurred late in the evening over Colorado Springs:

No flooding was reported yesterday. For precipitation estimates in our area, check out the map below.
Click Here For Map Overview

The map below shows radar-estimated, rainfall gage-adjusted Quantitative Precipitation Estimates (QPE) across Colorado. The map is updated daily during the operational season (May 1 – Sep 30) by 11AM. The following six layers are currently available: 24-hour, 48-hour and 72-hour total precipitation, as well as maximum 1-hour, 2-hour and 6-hour precipitation over the past 24 hour period (to estimate where flash flooding may have occurred). The accumulation ending time is 7AM of the date shown in the bottom right corner. Also shown optionally are vulnerable fire burn areas (post 2012), which are updated throughout the season to include new, vulnerable burn areas. The home button in the top left corner resets the map to the original zoom.

SPM 07-18-2022: Showers and Thunderstorms for Southwest Colorado

Issue Date: Monday, July 17th, 2022
Issue Time: 10:15 AM MDT

Summary:

High pressure over the Four Corners region dominated weather across Colorado yesterday, limiting precipitation and maintaining very hot and dry conditions. Still, some late afternoon high-based storms were able to develop over the high terrain in the San Juan and Southeast Mountains, as well as the Southwest Slope. Calm low-level winds allowed for storms that did develop to remain largely stationary, increasing localized rainfall totals.

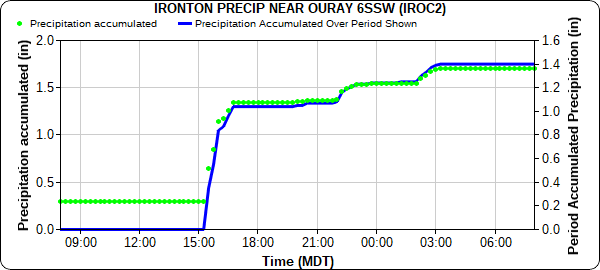
A MesoWest gage at Ironton, south of Ouray, picked up 1.14 inches of rain yesterday, with 1.04 of that falling in the two hours between 3:00-5:00 pm, as seen in the hyetograph below. A bit further north, 0.72 inches of rain was recorded at another MesoWest gauge on Dallas Creek near Ridgeway, with 0.61 of the daily total falling between 4:00-5:00 pm. CoCoRaHS observers across Ouray County reported 0.42-0.49 inches in the towns of Ouray and Ridgeway as well. Precipitation in the southwest tapered off through the evening, with just lingering widely-scattered showers in the Southwest Slope by nightfall. Precipitation totals in this area range from 0.05-0.25, with up to 0.41 reported from a CoCoRaHS observer in Mancos.

Gusty outflow winds from afternoon storms on the San Juan Mountains resulted in a few high-wind reports for non-thunderstorm wind gusts exceeding 45-mph at both Gunnison and Grand Junction regional airports. For the rest of the state, conditions were hot and dry, with temperatures in the upper 90s for the Eastern Plains, 80s for the high elevations, and upper 90s and even 100s for the Grand Valley and Western Slopes

Of note on today’s QPE map – the small area of 1-2 inch rainfall in Lincoln-Kit Carson-Cheyenne counites is from a radar artifact from a wind farm, not actual precipitation. For precipitation estimates in our area, check out the map below.
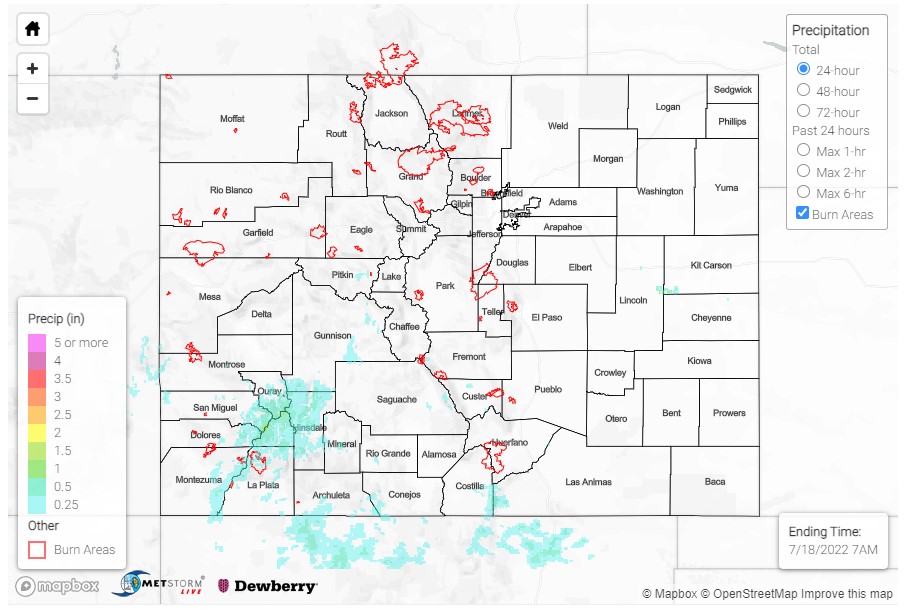
Click Here For Map Overview

The map below shows radar-estimated, rainfall gage-adjusted Quantitative Precipitation Estimates (QPE) across Colorado. The map is updated daily during the operational season (May 1 – Sep 30) by 11AM. The following six layers are currently available: 24-hour, 48-hour and 72-hour total precipitation, as well as maximum 1-hour, 2-hour and 6-hour precipitation over the past 24 hour period (to estimate where flash flooding may have occurred). The accumulation ending time is 7AM of the date shown in the bottom right corner. Also shown optionally are vulnerable fire burn areas (post 2012), which are updated throughout the season to include new, vulnerable burn areas. The home button in the top left corner resets the map to the original zoom.