Issue Date: Tuesday, July 19th, 2022
Issue Time: 10:45 AM MDT
Summary:
High pressure shifted southward on Monday as deep westerly flow overspread most of Colorado. The record-breaking heat continued, with Akron, Limon, and Denver setting new record high temperatures. Orographic lift and a weak wave aloft led to isolated to widely scattered showers and storms developing over the interior mountains and valleys by the afternoon, although convection struggled to move off the high terrain and into the Plains. Moisture was mainly confined to the mid-levels with inverted-V soundings present, limiting the threats with any storms to gusty outflow winds and brief heavy rainfall. A 70-mph gust was reported near Peterson Air Force Base, while outflow winds gusted over 50 mph at Pueblo Airport. 1.25” hail was reported near Trinidad.
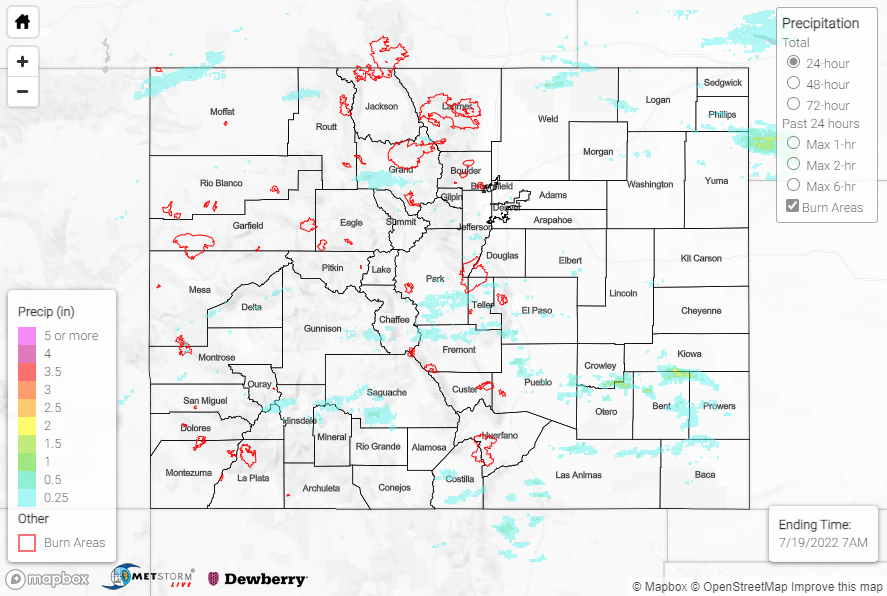
Rainfall amounts over the high terrain and foothills were generally 0.25-0.50”, but up to 0.81” was measured just west of Colorado Springs. The heaviest rainfall fell across the Southeast Plains, where QPE data suggests localized amounts exceeding 1.50” occurred along the U.S. Highway 50 corridor. Gauge observations in this vicinity are sparse, but CoCoRaHS observers reported 1.03” and 0.65” just north of La Junta and Lamar, respectively.
Additionally, a heat burst occurred late in the evening over Colorado Springs:
*Interesting Weather Phenomenon*
Last night, a unique weather event occurred over Colorado Springs. A weakening/collapsing thunderstorm caused a Heat Burst over the area with winds gusting to 70 mph and then temperatures increasing by almost 6°F in a short period of time! #cowx pic.twitter.com/FbnvCQq7ZC
— NWS Pueblo (@NWSPueblo) July 19, 2022
No flooding was reported yesterday. For precipitation estimates in our area, check out the map below.
