SPM 07-10-2018: Isolated Thunderstorms for Western Colorado

Issue Date: Tuesday, July 10, 2018
Issue Time: 09:50 AM MDT

Summary:

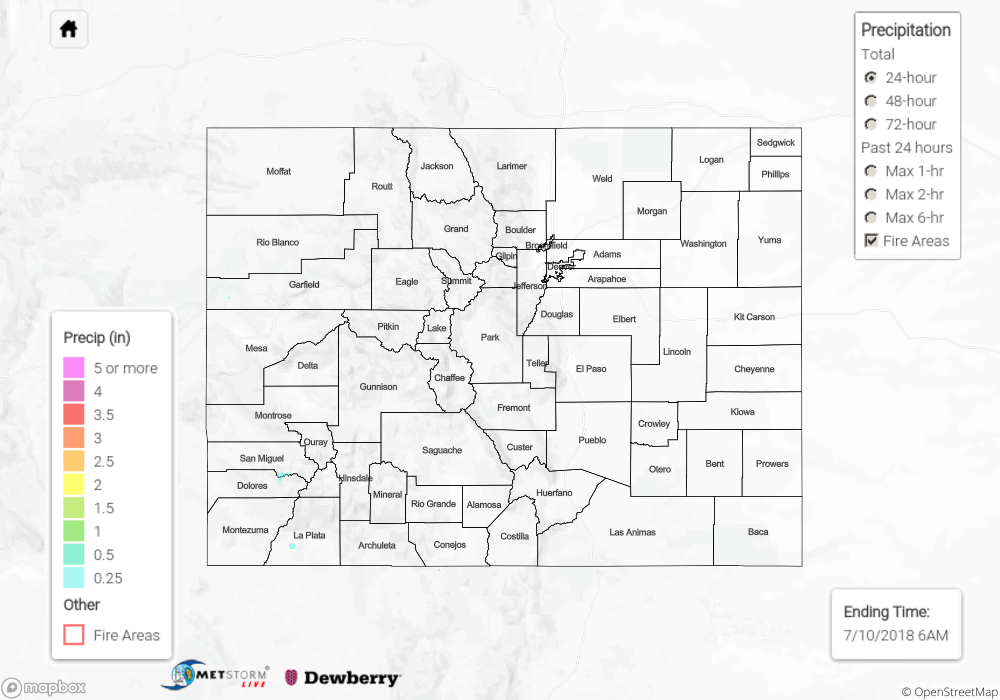
With the high pressure over the Nebraska panhandle and the ridge’s slow movement to the east, another day of clockwise rotation occurred in Colorado’s upper atmosphere. This pulled in some very dry air from the east at the low-levels and pushed the main subtropical moisture over western Colorado further west into Utah and Arizona. Between these two factors, the intensity and coverage of the storms yesterday were reduced. Over eastern Colorado, general subsidence and the entrainment of dry air allowed only for a few light showers over the higher terrains. The southwest corner of the state was the most active on Monday with thunderstorms kicking off over the San Juan Mountains by 3PM. CoCoRaHS in the area just south of the San Juan Mountains recorded up to 0.3 inches of rain. Near the two main burn areas, ASOS stations recorded just over 0.10 inches with the Scotch Creek SNOTEL receiving 0.5 inches. Luckily, none of the higher rain rate producing storms tracked directly over the burn areas. More isolated showers and thunderstorms occurred over the Central Mountains, Grand Valley and northwest corner of the state. Radar rainfall estimates were under 0.1 inches. All thunderstorm and shower activity ended by 11PM.

There was no flooding reported on Monday. To see how much precipitation fell in your area, scroll down to the State Precipitation Map below.

Click Here For Map Overview

The map below shows radar-estimated, rainfall gage-adjusted Quantitative Precipitation Estimates (QPE) across Colorado. The map is updated daily during the operational season (May 1 – Sep 30) by 11AM. The following six layers are currently available: 24-hour, 48-hour and 72-hour total precipitation, as well as maximum 1-hour, 2-hour and 6-hour precipitation over the past 24 hour period (to estimate where flash flooding may have occurred). The 24-hour, 48-hour and 72-hour total precipitation contain bias corrections that are not disaggregated into the hourly estimates, so there will likely be some differences. The accumulation ending time is 6AM of the date shown in the bottom right corner. Also shown optionally are fire burn areas (post 2012), which are updated throughout the season to include new burn areas. The home button in the top left corner resets the map to the original zoom.

SPM 07-09-2018: Another Round of Showers and Thunderstorms as Moisture Remained Under the Ridge

Issue Date: Monday, July 9, 2018
Issue Time: 09:42 AM MDT

Summary:

Moisture remained trapped under the mid-level ridge yesterday, which provided another round of afternoon showers and thunderstorms over and near the higher terrains. Thunderstorms kicked off by 2PM with the western half of Colorado receiving the most action. Storm motion was to the east due to the location of the high, which is a bit different than normal. A late day thunderstorm moved over the southern Denver Metro area, with totals up to 0.3 inches recorded by the ALERT network.

Two flood advisories were issued for Sunday. One was at 5PM for Dolores and San Miguel County where enough rain had fallen to trigger minor debris flows along Highway 145 near Rico. Scottish Creek SNOTEL (over the same area) recorded 1.3 inches and Black Mesa SNOTEL recorded 0.9 inches. The second flood advisory was in Larimer County at 10PM for heavy rainfall near Mishawaka (16 miles NW of Fort Collins) and the High Park burn scar. Radar rainfall estimates were just over 0.5 inches, but no flooding had been reported as of this morning. Thunderstorm activity ended by 9PM with a few showers lingering over the northern, high terrains until midnight.

To see how much precipitation fell in your area, scroll down to the State Precipitation Map below.

Click Here For Map Overview

The map below shows radar-estimated, rainfall gage-adjusted Quantitative Precipitation Estimates (QPE) across Colorado. The map is updated daily during the operational season (May 1 – Sep 30) by 11AM. The following six layers are currently available: 24-hour, 48-hour and 72-hour total precipitation, as well as maximum 1-hour, 2-hour and 6-hour precipitation over the past 24 hour period (to estimate where flash flooding may have occurred). The 24-hour, 48-hour and 72-hour total precipitation contain bias corrections that are not disaggregated into the hourly estimates, so there will likely be some differences. The accumulation ending time is 6AM of the date shown in the bottom right corner. Also shown optionally are fire burn areas (post 2012), which are updated throughout the season to include new burn areas. The home button in the top left corner resets the map to the original zoom.

SPM 07-08-2018: Scattered Storms over the High Country, a Couple Isolated Storms over the Urban Corridor

Issue Date: Sunday, July 8th, 2018
Issue Time: 9:30 AM MDT

Summary:

Underneath a ridge of high pressure aloft, recycled moisture was tapped into by orographic lift and strong daytime heating to produce showers and thunderstorms over the mountains. The best coverage of storms occurred along and west of the Continental Divide, while east of the Continental Divide, the mountains were dotted with more isolated coverage. Owing to a lack of wind shear aloft, storms were poorly organized, producing gusty winds, lightning, and light-to-moderate rainfall.

A few isolated thunderstorms were able to overcome steep odds to develop over the Urban Corridor, as a weak surface boundary set up over the area. The boundary provided enough lift to aid daytime heat in the creation of a couple storms during the afternoon/evening hours. Due to the dry air below the elevated cloud bases, gusty winds and cloud-to-ground lightning were the main impacts, with brief periods of light rainfall.

A Flash Flood Warning was issued for the 416 Fire burn area as heavy rain fell across the burn scar, but no observed flooding issues were reported. However, it is possible that heavy rain caused debris slides/mud flows within the 416 Fire and Burro Fire burn scars. For a look at precipitation estimates in your area, please see our State Precipitation Map below.

Click Here For Map Overview

The map below shows radar-estimated, rainfall gage-adjusted Quantitative Precipitation Estimates (QPE) across Colorado. The map is updated daily during the operational season (May 1 – Sep 30) by 11AM. The following six layers are currently available: 24-hour, 48-hour and 72-hour total precipitation, as well as maximum 1-hour, 2-hour and 6-hour precipitation over the past 24 hour period (to estimate where flash flooding may have occurred). The 24-hour, 48-hour and 72-hour total precipitation contain bias corrections that are not disaggregated into the hourly estimates, so there will likely be some differences. The accumulation ending time is 6AM of the date shown in the bottom right corner. Also shown optionally are fire burn areas (post 2012), which are updated throughout the season to include new burn areas. The home button in the top left corner resets the map to the original zoom.

SPM 07-07-2018: Slow-Moving Thunderstorms over the High Country

Issue Date: Saturday, July 7th, 2018
Issue Time: 9:30 AM MDT

Summary:

Underneath a ridge of high pressure aloft, daytime heating, orographic lift, and a couple weak disturbances were the driving forces behind yesterday’s showers and thunderstorms. Activity was mainly anchored to the higher terrain thanks to weak steering flow winds. A few lower elevations on the Western Slope got in on some light rainfall, but not much more. The Southwest Slope and San Juan Mountains received the bulk of precipitation yesterday, thanks to being influenced by the best moisture. Most activity over the High Country ended around 9 PM, with lingering showers/thunderstorms over southwest Colorado into the early morning hours. East of the mountains, only a couple high-based showers and garden-variety thunderstorms could be found over the Raton Ridge during the afternoon hours.

A Flash Flood Warning was issued for the 416 Fire burn area as heavy rain fell across the burn scar, but no observed flooding issues were reported. However, it is possible that heavy rain caused debris slides/mud flows within the 416 Fire and Burro Fire burn scars. For a look at precipitation estimates in your area, please see our State Precipitation Map below.

Click Here For Map Overview

The map below shows radar-estimated, rainfall gage-adjusted Quantitative Precipitation Estimates (QPE) across Colorado. The map is updated daily during the operational season (May 1 – Sep 30) by 11AM. The following six layers are currently available: 24-hour, 48-hour and 72-hour total precipitation, as well as maximum 1-hour, 2-hour and 6-hour precipitation over the past 24 hour period (to estimate where flash flooding may have occurred). The 24-hour, 48-hour and 72-hour total precipitation contain bias corrections that are not disaggregated into the hourly estimates, so there will likely be some differences. The accumulation ending time is 6AM of the date shown in the bottom right corner. Also shown optionally are fire burn areas (post 2012), which are updated throughout the season to include new burn areas. The home button in the top left corner resets the map to the original zoom.