Issue Date: Monday, July 9, 2018
Issue Time: 09:42 AM MDT
Summary:
Moisture remained trapped under the mid-level ridge yesterday, which provided another round of afternoon showers and thunderstorms over and near the higher terrains. Thunderstorms kicked off by 2PM with the western half of Colorado receiving the most action. Storm motion was to the east due to the location of the high, which is a bit different than normal. A late day thunderstorm moved over the southern Denver Metro area, with totals up to 0.3 inches recorded by the ALERT network.
Two flood advisories were issued for Sunday. One was at 5PM for Dolores and San Miguel County where enough rain had fallen to trigger minor debris flows along Highway 145 near Rico. Scottish Creek SNOTEL (over the same area) recorded 1.3 inches and Black Mesa SNOTEL recorded 0.9 inches. The second flood advisory was in Larimer County at 10PM for heavy rainfall near Mishawaka (16 miles NW of Fort Collins) and the High Park burn scar. Radar rainfall estimates were just over 0.5 inches, but no flooding had been reported as of this morning. Thunderstorm activity ended by 9PM with a few showers lingering over the northern, high terrains until midnight.
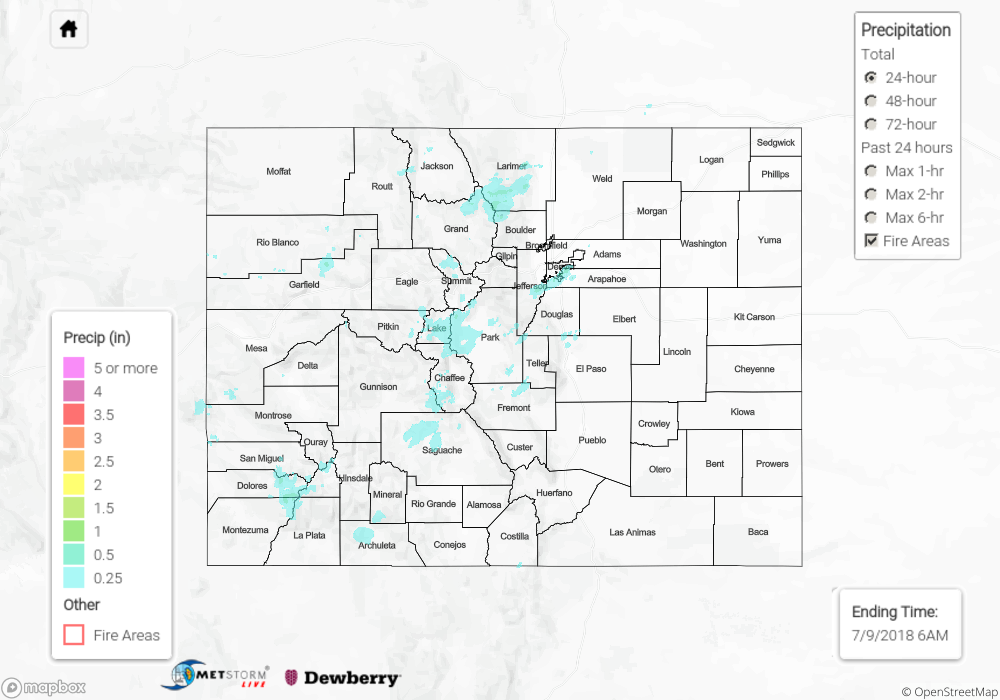
To see how much precipitation fell in your area, scroll down to the State Precipitation Map below.
Click Here For Map Overview