SPM 07-20-2019: Hot and Dry Weather Continues

Issue date: Saturday, July 20th, 2019
Issue time: 10:50AM MDT

Summary:

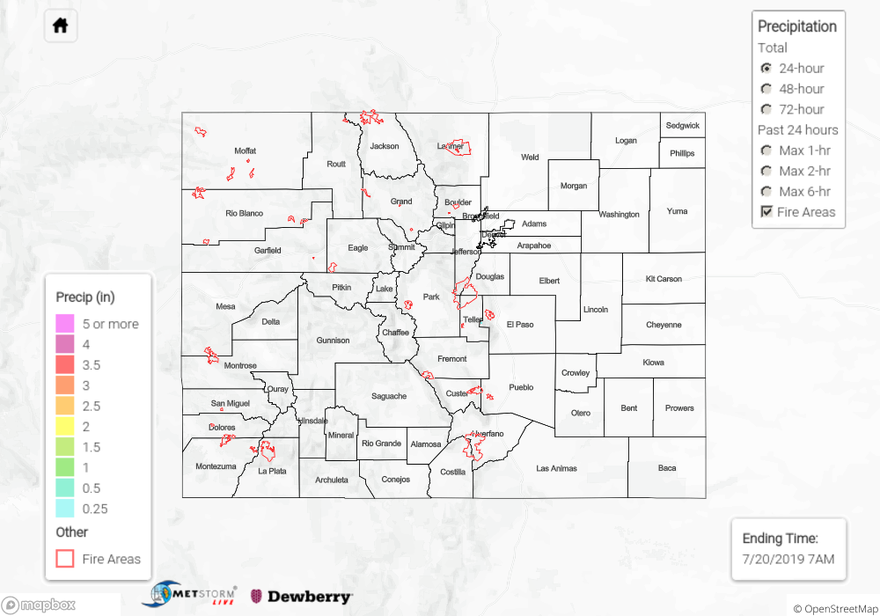
Another day of hot and dry weather over Colorado yesterday, as dry air continued to move in from the west and southwest. Moisture did however increase throughout the afternoon and last night as flow shifted to the south, bringing in moisture from the Baja Peninsula. Brief, very light showers occurred over the far Southeast Plains around midnight last night, with radar deriving up to under 0.1 inches over Baca, Bent and Prowers Counties as a shortwave clipped the area. The main story yesterday was the hot weather, high temperatures were measured in the 100°Fs all across the eastern plains, with a recording of 111°F at Lamar Municipal Airport in Prowers County. The Red Flag Warning over western and norther Colorado has been lifted as moisture moved into the area last night.

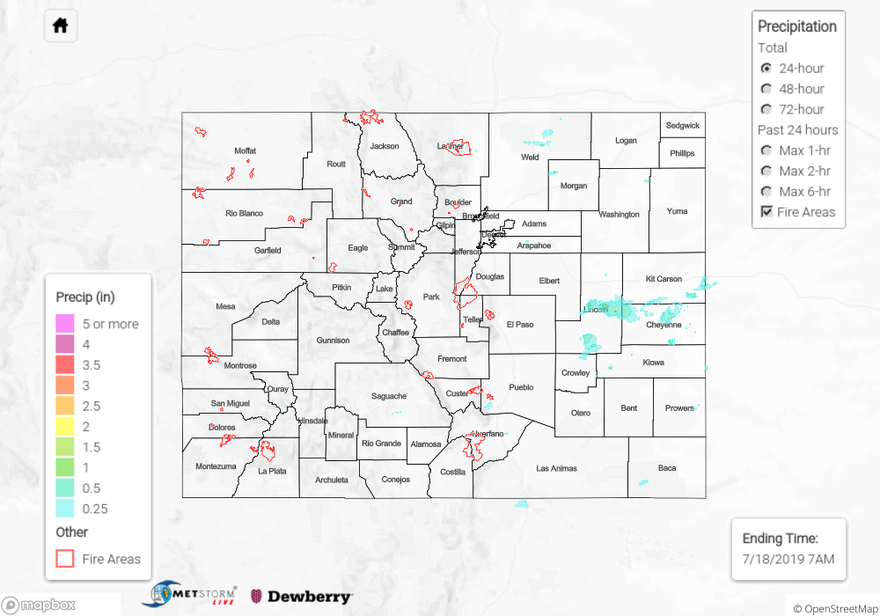
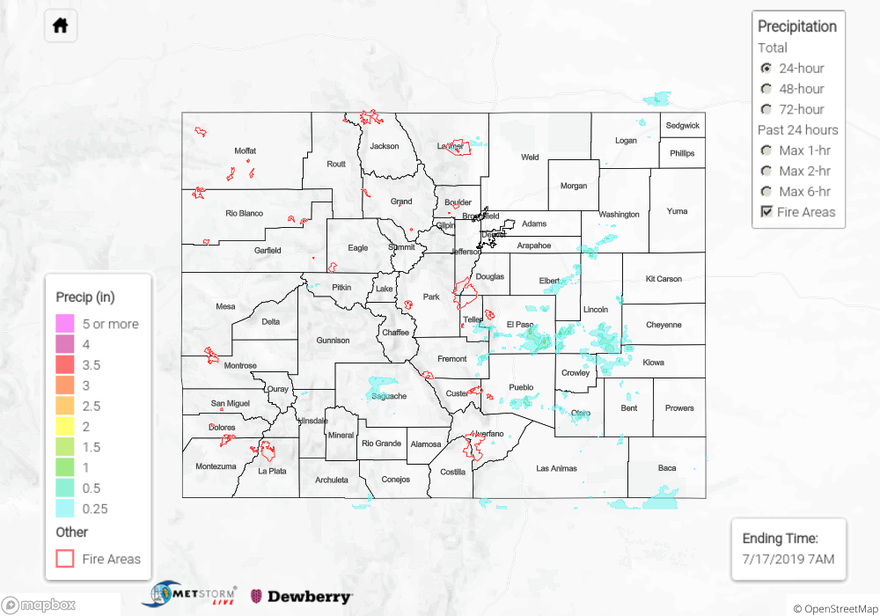
For a look at precipitation over your area (72-hours ago), please visit the State Precipitation Map below. Note the rainfall over the far Southeast corner is not shown because totals were under 0.25 inches.

Click Here For Map Overview

The map below shows radar-estimated, rainfall gage-adjusted Quantitative Precipitation Estimates (QPE) across Colorado. The map is updated daily during the operational season (May 1 – Sep 30) by 11AM. The following six layers are currently available: 24-hour, 48-hour and 72-hour total precipitation, as well as maximum 1-hour, 2-hour and 6-hour precipitation over the past 24 hour period (to estimate where flash flooding may have occurred). The 24-hour, 48-hour and 72-hour total precipitation contain bias corrections that are not disaggregated into the hourly estimates, so there will likely be some differences. The accumulation ending time is 7AM of the date shown in the bottom right corner. Also shown optionally are vulnerable fire burn areas (post 2012), which are updated throughout the season to include new, vulnerable burn areas. The home button in the top left corner resets the map to the original zoom.

SPM 07-19-2019: Rain Free Day with Sizzling Hot Temperatures

Issue Date: Friday, July 19th, 2019
Issue Time: 9:15AM MDT

Summary:

With a high over Arizona and upper level flow from the west, conditions over Colorado yesterday were hot and dry. There was no measurable rain recorded anywhere over the state. The main weather stories yesterday were the hot temperatures and gusty winds. A Red Flag Warning was issued for another day over western Colorado. As far as wildfires, it has been quiet so far thanks to the high winter snowpack and wet spring. The Doe Canyon Fire burned ~2,500 acres near Dove Creek, CO. According to InciWeb, this fire is now 100% contained. Snowpack continues to melt at the highest elevations keeping rivers running high (for this point in the season), but no flooding is being reported with the peak in streamflow behind us.

To see estimated precipitation totals over the last 72-hours, scroll down the State Precipitation Map below.

Click Here For Map Overview

The map below shows radar-estimated, rainfall gage-adjusted Quantitative Precipitation Estimates (QPE) across Colorado. The map is updated daily during the operational season (May 1 – Sep 30) by 11AM. The following six layers are currently available: 24-hour, 48-hour and 72-hour total precipitation, as well as maximum 1-hour, 2-hour and 6-hour precipitation over the past 24 hour period (to estimate where flash flooding may have occurred). The 24-hour, 48-hour and 72-hour total precipitation contain bias corrections that are not disaggregated into the hourly estimates, so there will likely be some differences. The accumulation ending time is 7AM of the date shown in the bottom right corner. Also shown optionally are vulnerable fire burn areas (post 2012), which are updated throughout the season to include new, vulnerable burn areas. The home button in the top left corner resets the map to the original zoom.

SPM 07-18-2019: Thunderstorms over the Eastern Plains

Issue date: Thursday, July 18, 2019
Issue Time: 9:35AM MDT

Summary:

Convergence along the dryline over the eastern plains produced moderate thunderstorms over the Palmer Ridge and Northeast Plains yesterday afternoon. Radar derived up to 1 inch of rain over Lincoln, Kit Carson and Cheyenne Counties. A surface report from a CWOP station near Hugo in Lincoln county reported the highest accumulation for the day, measuring 0.46 inches. Weak upslope flow over the foothills provided afternoon showers over the Urban Corridor, extending south into Pueblo County. Dry air and quick mid to upper level winds weakened chances for thunderstorms over the area by preventing deep cloud development. CoCoRaHS stations recorded less than 0.16 inches of rain over the area. Storms developed over the eastern San Juan Mountains and drifted over the San Luis Valley, with surface reports of up to 0.12 inches. High temperatures increased from Tuesday’s values, with reports of 106°F over Lamar in Prowers County.

For a look at precipitation over your area, please visit the State Precipitation Map below.

Click Here For Map Overview

The map below shows radar-estimated, rainfall gage-adjusted Quantitative Precipitation Estimates (QPE) across Colorado. The map is updated daily during the operational season (May 1 – Sep 30) by 11AM. The following six layers are currently available: 24-hour, 48-hour and 72-hour total precipitation, as well as maximum 1-hour, 2-hour and 6-hour precipitation over the past 24 hour period (to estimate where flash flooding may have occurred). The 24-hour, 48-hour and 72-hour total precipitation contain bias corrections that are not disaggregated into the hourly estimates, so there will likely be some differences. The accumulation ending time is 7AM of the date shown in the bottom right corner. Also shown optionally are vulnerable fire burn areas (post 2012), which are updated throughout the season to include new, vulnerable burn areas. The home button in the top left corner resets the map to the original zoom.

SPM 07-17-2019: Isolated Moderate Rainfall over the Eastern Plains

Issue date: Wednesday, July 17, 2019
Issue time: 10AM MDT

Summary:

Flow around the high pressure centered over New Mexico brought midlevel moisture to the high country yesterday, producing weak thunderstorms over the area. Storms off of the southern Front Range and Palmer Ridge picked up moderate levels of surface moisture from the plains as they traveled to the east off of the mountains. A severe thunderstorm warning was issued at 4PM yesterday over Elbert County, with reports to the NWS of wind gusts up to 63 mph. A shortwave passing over Wyoming provided additional lift for thunderstorms over the northern Front Range, with CoCoRaHS stations reporting up to 0.37 inches of rain to the north of Fort Collins. The highest accumulation for the day was in El Paso County, where a thunderstorm produced 0.59 inches of rain to the southeast of Colorado Springs. Radar derived up to 1 inch of rain within the storm, but hot, dry air underneath the storm base likely caused some of the rain to evaporate before reaching the surface. Other notable totals were measured near Pagosa Springs in Archuleta County, with CoCoRaHS measuring 0.33 and 0.28 inches over the area.

For a look at precipitation over your area, please visit the State Precipitation Map below.

Click Here For Map Overview

The map below shows radar-estimated, rainfall gage-adjusted Quantitative Precipitation Estimates (QPE) across Colorado. The map is updated daily during the operational season (May 1 – Sep 30) by 11AM. The following six layers are currently available: 24-hour, 48-hour and 72-hour total precipitation, as well as maximum 1-hour, 2-hour and 6-hour precipitation over the past 24 hour period (to estimate where flash flooding may have occurred). The 24-hour, 48-hour and 72-hour total precipitation contain bias corrections that are not disaggregated into the hourly estimates, so there will likely be some differences. The accumulation ending time is 7AM of the date shown in the bottom right corner. Also shown optionally are vulnerable fire burn areas (post 2012), which are updated throughout the season to include new, vulnerable burn areas. The home button in the top left corner resets the map to the original zoom.