Issue date: Wednesday, July 17, 2019
Issue time: 10AM MDT
Summary:
Flow around the high pressure centered over New Mexico brought midlevel moisture to the high country yesterday, producing weak thunderstorms over the area. Storms off of the southern Front Range and Palmer Ridge picked up moderate levels of surface moisture from the plains as they traveled to the east off of the mountains. A severe thunderstorm warning was issued at 4PM yesterday over Elbert County, with reports to the NWS of wind gusts up to 63 mph. A shortwave passing over Wyoming provided additional lift for thunderstorms over the northern Front Range, with CoCoRaHS stations reporting up to 0.37 inches of rain to the north of Fort Collins. The highest accumulation for the day was in El Paso County, where a thunderstorm produced 0.59 inches of rain to the southeast of Colorado Springs. Radar derived up to 1 inch of rain within the storm, but hot, dry air underneath the storm base likely caused some of the rain to evaporate before reaching the surface. Other notable totals were measured near Pagosa Springs in Archuleta County, with CoCoRaHS measuring 0.33 and 0.28 inches over the area.
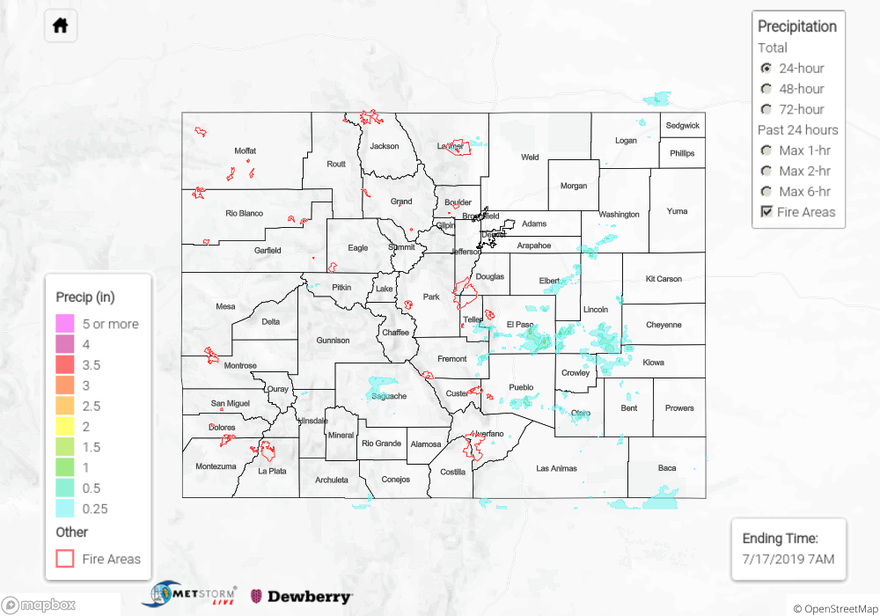
For a look at precipitation over your area, please visit the State Precipitation Map below.
Click Here For Map Overview