SPM 08-17-2019: Moderate Rainfall and Hail over the Northeast Plains

Issue Date: Saturday, August 16th, 2019
Issue Time: 9:55 AM MDT

Summary:

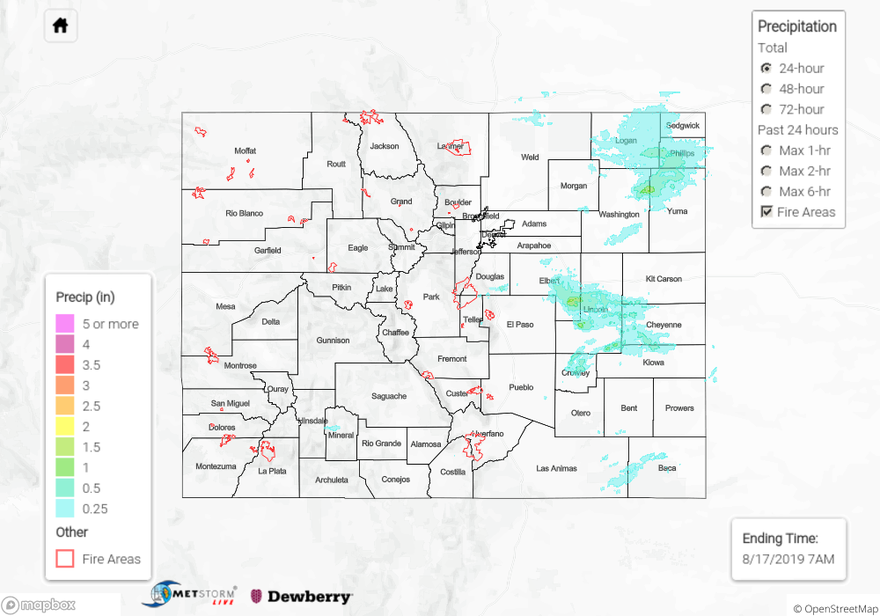
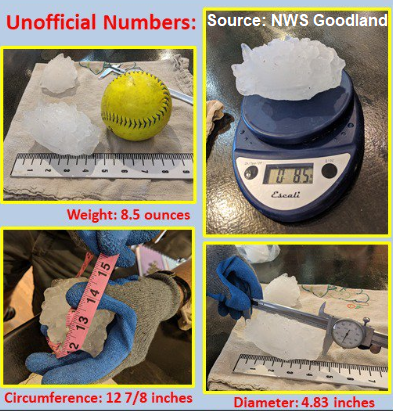
Thunderstorms developed early yesterday afternoon over the Cheyenne Ridge and Palmer Ridge and moved eastwards throughout the afternoon and early evening. Early morning fog and cloud cover over the Northeast Plains delayed storm development over the area until later in the afternoon, but by peak heating southerly moving outflow boundaries from storms over southern Wyoming were finally able to trigger some storms by 4PM. Over the Palmer Ridge and central eastern plains, storms developed along the stationary front that remained over the area throughout the afternoon. The Northeast Plains saw hail once again yesterday from Logan County down to Cheyenne County. The largest hail report came in just to the north of Sterling Reservoir (Logan County) at 2.5 inches, which is the size of a tennis ball. As for rainfall there were some moderate totals over the northeast corner of the state, with a CoCoRaHS station in eastern Logan County reporting up to 1.08 inches for the 24-hour period. Metstorm derived the highest hourly rainfall rate of 1.47 inches over Washington and Yuma counties. Radar additionally derived a little over 1.5 inches for the 24 hour period over southeastern Elbert County.

Back to the west things stayed pretty dry with the Red Flag Warning still in place today. There were a few brief storms over the Central Mountains, Northern Mountains and San Juan Mountains early yesterday afternoon, but storm totals were mostly confined to trace amounts. Fast steering winds aloft and dry surface conditions broke up most storms before they were able to fully develop. The highest measured total for the 24-hour period was over western Saguache County (eastern San Juan Mountains) at 0.13 inches. Radar derived a little over 0.25 inches over Mineral County, but evaporation likely limited surface accumulation below this amount.

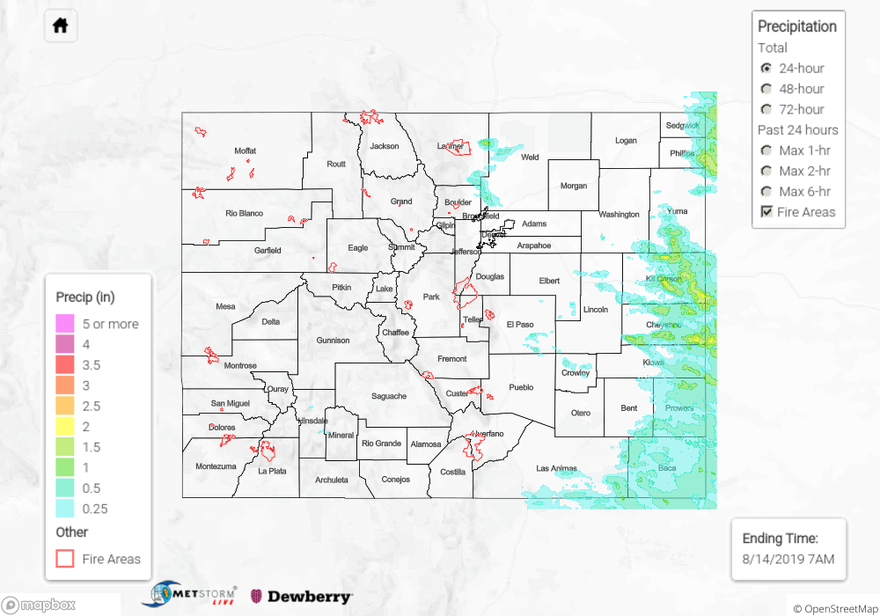
For a look at precipitation in your area, please visit the State Precipitation Map below.

Click Here For Map Overview

The map below shows radar-estimated, rainfall gage-adjusted Quantitative Precipitation Estimates (QPE) across Colorado. The map is updated daily during the operational season (May 1 – Sep 30) by 11AM. The following six layers are currently available: 24-hour, 48-hour and 72-hour total precipitation, as well as maximum 1-hour, 2-hour and 6-hour precipitation over the past 24 hour period (to estimate where flash flooding may have occurred). The 24-hour, 48-hour and 72-hour total precipitation contain bias corrections that are not disaggregated into the hourly estimates, so there will likely be some differences. The accumulation ending time is 7AM of the date shown in the bottom right corner. Also shown optionally are vulnerable fire burn areas (post 2012), which are updated throughout the season to include new, vulnerable burn areas. The home button in the top left corner resets the map to the original zoom.

SPM 08-16-2019: Relatively Calm Day with Seasonable Temperatures

Issue Date: Friday, August 16th, 2019
Issue Time: 10:50AM MDT

Summary:

The state began to dry out yesterday underneath a northwesterly flow regime.  Early morning fog over the Northeast Plains allowed for weak instability to build over the South Platte River Valley yesterday, which lead to a round of brief thunderstorms during the afternoon. Most of the storms were high-based and quick-paced with very low rainfall totals. The Northeast Plains remained capped, so severe thunderstorms were avoided.

The highest observed rainfall total yesterday was measured in Iliff (Logan County) where 0.25 inches of rain was recorded at a COOP station. Isolated thunderstorms also formed over the eastern Palmer Ridge late yesterday afternoon near the strong moisture gradient with storm totals just over 0.25 inches estimated by MetStorm. Dew points between the Palmer Ridge and the surrounding low laying plains had a difference up to 25°F due to gusty downsloping winds from the higher terrains throughout the morning, which kept totals to the west must lower than east of this boundary. The highest total yesterday was over Cheyenne County where MetStorm estimated just under 0.5 inches of rain.

Some early afternoon showers popped up on radar over the southern San Juan Mountains yesterday with some residual moisture mixing with the daily upslope flow regime. Showers also lingered over Archuleta, Hinsdale and Mineral Counties throughout the afternoon, but surface accumulations were only trace amounts. Therefore, these storms mostly produced cloud cover with plenty of virga. Some additional weak storms moved in over the Northwest Slope from the UT/WY border, but weak forcing and low moisture kept rainfall totals to trace amounts as well. Dry air underneath the base of the storm lead to some strong outflow winds with 45 and 50 mph gusts recorded at ASOS stations near Craig (eastern Moffat County) and Silt (central Garfield County), respectively.

For a look at precipitation over your area, please visit the State Precipitation Map below.

Click Here For Map Overview

The map below shows radar-estimated, rainfall gage-adjusted Quantitative Precipitation Estimates (QPE) across Colorado. The map is updated daily during the operational season (May 1 – Sep 30) by 11AM. The following six layers are currently available: 24-hour, 48-hour and 72-hour total precipitation, as well as maximum 1-hour, 2-hour and 6-hour precipitation over the past 24 hour period (to estimate where flash flooding may have occurred). The 24-hour, 48-hour and 72-hour total precipitation contain bias corrections that are not disaggregated into the hourly estimates, so there will likely be some differences. The accumulation ending time is 7AM of the date shown in the bottom right corner. Also shown optionally are vulnerable fire burn areas (post 2012), which are updated throughout the season to include new, vulnerable burn areas. The home button in the top left corner resets the map to the original zoom.

SPM 08-15-2019: Large Hail Producing Severe Thunderstorm over the Northeast Plains & an (Unofficial) New State Hail Stone Record!

Issue Date: Thursday, August 15th, 2019
Issue Time: 9:30AM MDT

Summary:

Once again, the main weather story on Thursday was a severe thunderstorm over the far eastern plains. The threat yesterday was over a much smaller area than Tuesday, but the cap was broken and the environment was right for some large hail and strong winds with CAPE and shear parameters fairly high along the border. A Severe Thunderstorm Watch was issued for the Northeast Plains just after 4PM with the lone, large storm of the day gaining strength as it moved in from Wyoming into Yuma County. This storm traveled south along the border and produced 3 inch diameter hail (tea cup size) in Yuma County and a 70mph gust (measurement taken in Kit Carson County near Stratton). Throughout its life cycle, it produced a lot of hail ranging from 1 inch to 2.5 inches, which stripped crops of their leaves. Speaking of hail, it looks like the hail stone from Tuesday might have broken a new state record (not official yet). The hail stone measured 4.83 inches in diameter, which was after 30 minutes after it fell – meaning it was likely bigger! It weighed 8.5 ounces and its widest circumference was 12 7/8 inches. Take a look at the photo from the Goodland NWS office below.

As far as rainfall totals, the storm over the eastern plains had max 1-hour rain rates up to 1.65 inches. Additional storms that fired along the Southeast Mountains, and moved over the Raton Ridge, produced totals up to 0.6 inches. One stationary storm along the southern edge of Costilla County had an Areal Flood Advisory at 6:30PM. Radar estimates a small area received up to 1.2 inches of rain with 1-hour rain rates just under 1 inch, but there were no flooding reports as of this morning or observations in the area.

To see estimated precipitation totals over your neighborhood on Wednesday, scroll down the State Precipitation Map below.

Click Here For Map Overview

The map below shows radar-estimated, rainfall gage-adjusted Quantitative Precipitation Estimates (QPE) across Colorado. The map is updated daily during the operational season (May 1 – Sep 30) by 11AM. The following six layers are currently available: 24-hour, 48-hour and 72-hour total precipitation, as well as maximum 1-hour, 2-hour and 6-hour precipitation over the past 24 hour period (to estimate where flash flooding may have occurred). The 24-hour, 48-hour and 72-hour total precipitation contain bias corrections that are not disaggregated into the hourly estimates, so there will likely be some differences. The accumulation ending time is 7AM of the date shown in the bottom right corner. Also shown optionally are vulnerable fire burn areas (post 2012), which are updated throughout the season to include new, vulnerable burn areas. The home button in the top left corner resets the map to the original zoom.

SPM 08-14-2019: Heavy Rain for the Far Eastern Plains along with a Tornado and a Possible Record Breaking Hailstone

Issue Date: Wednesday, August 14th, 2019
Issue Time: 10:20AM MDT

Summary:

Tuesday was another busy day on the severe weather front, which was not too surprising given the atmospheric pattern. A strong dry line setup over the eastern plains with westerly flow aloft, and helped produce some very strong thunderstorms in a high shear and CAPE environment. Storm motion was fairly quick to the southeast, but there were still some impressive 1-hour totals (around 2.25 inches)! A tornado watch was issued for the Northeast Plains at 1PM and the storms initiated shortly after along the boundary. The storm produced a couple of tornado touchdowns in Yuma and Kit Carson Counties, but hard to tell in some pictures due to the tornado being rain wrapped. Large hail also accompanied the storms. There was a ~5 inch diameter hailstone reported in Bethune via Twitter. This will still need to be verified, but if it does, this will be a new state record. See: https://climate.colostate.edu/records.html for more information about hail records. There were several other reports of large hail with these storms ranging from 1.75 inches to 2.75 inches

Not surprisingly, there was flooding reported near Burlington where radar estimates around 1.75 inches fell. There were two Flash Flood Warnings for the County between 3 and 6PM. A CoCoRaHS station in town recorded 1.34 inches for the event. In Stratton, CO (north, central Kit Carson County) there was a CoCoRaHS station that reported 1.58 inches, which was the highest report of the day for the eastern plains. Storms then moved south along the tail end of the MCS in Kansas caused some more rainfall over the Southeast Plains. Additional storms fired with these outflow boundaries over the area in the high moisture environment. Radar indicates just over 1 inch fell with more general storm totals around 0.6 inches. Light to moderate rain continued into this morning.

An outflow boundary from the Northeast Plain storms initiated another set of thunderstorms over the northern Front Range and adjacent plains. When it pushed back west, it broke the cap over the foothills. Hail between 1 and 1.25 inches fell between 10 and 11PM over the Weld/Larimer/Boulder County intersect. A rain gage just south of Wellington picked up 0.5 inches along with an ALERT gage in Longmont. Radar indicates up to 1.5 inches of rain fell just southeast of Longmont. There was no flooding reported with these storms as of this morning.

To see estimated precipitation totals over your neighborhood on Tuesday, scroll down the State Precipitation Map below.

Click Here For Map Overview

The map below shows radar-estimated, rainfall gage-adjusted Quantitative Precipitation Estimates (QPE) across Colorado. The map is updated daily during the operational season (May 1 – Sep 30) by 11AM. The following six layers are currently available: 24-hour, 48-hour and 72-hour total precipitation, as well as maximum 1-hour, 2-hour and 6-hour precipitation over the past 24 hour period (to estimate where flash flooding may have occurred). The 24-hour, 48-hour and 72-hour total precipitation contain bias corrections that are not disaggregated into the hourly estimates, so there will likely be some differences. The accumulation ending time is 7AM of the date shown in the bottom right corner. Also shown optionally are vulnerable fire burn areas (post 2012), which are updated throughout the season to include new, vulnerable burn areas. The home button in the top left corner resets the map to the original zoom.