Issue Date: Saturday, August 16th, 2019
Issue Time: 9:55 AM MDT
Summary:
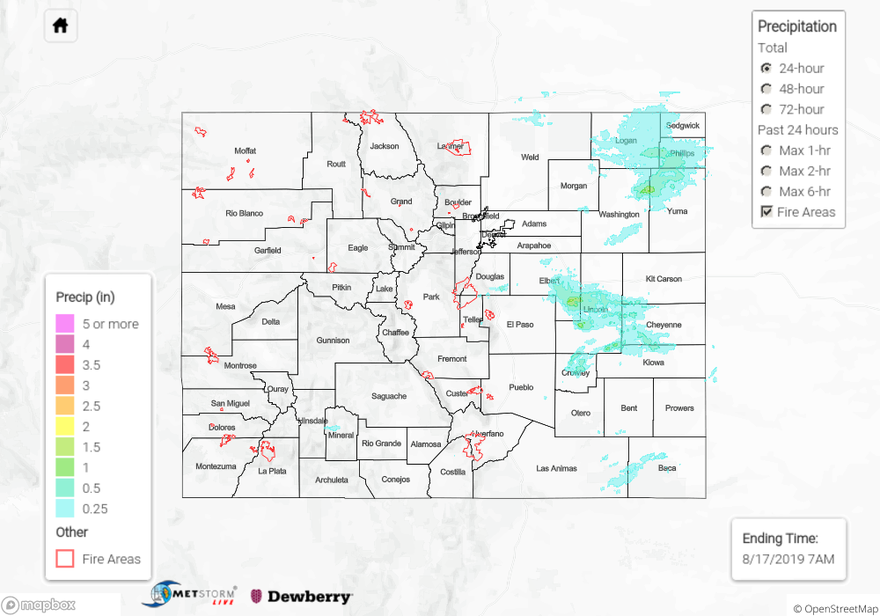
Thunderstorms developed early yesterday afternoon over the Cheyenne Ridge and Palmer Ridge and moved eastwards throughout the afternoon and early evening. Early morning fog and cloud cover over the Northeast Plains delayed storm development over the area until later in the afternoon, but by peak heating southerly moving outflow boundaries from storms over southern Wyoming were finally able to trigger some storms by 4PM. Over the Palmer Ridge and central eastern plains, storms developed along the stationary front that remained over the area throughout the afternoon. The Northeast Plains saw hail once again yesterday from Logan County down to Cheyenne County. The largest hail report came in just to the north of Sterling Reservoir (Logan County) at 2.5 inches, which is the size of a tennis ball. As for rainfall there were some moderate totals over the northeast corner of the state, with a CoCoRaHS station in eastern Logan County reporting up to 1.08 inches for the 24-hour period. Metstorm derived the highest hourly rainfall rate of 1.47 inches over Washington and Yuma counties. Radar additionally derived a little over 1.5 inches for the 24 hour period over southeastern Elbert County.
Back to the west things stayed pretty dry with the Red Flag Warning still in place today. There were a few brief storms over the Central Mountains, Northern Mountains and San Juan Mountains early yesterday afternoon, but storm totals were mostly confined to trace amounts. Fast steering winds aloft and dry surface conditions broke up most storms before they were able to fully develop. The highest measured total for the 24-hour period was over western Saguache County (eastern San Juan Mountains) at 0.13 inches. Radar derived a little over 0.25 inches over Mineral County, but evaporation likely limited surface accumulation below this amount.
For a look at precipitation in your area, please visit the State Precipitation Map below.
Click Here For Map Overview
