Issue Date: Friday, August 16th, 2019
Issue Time: 10:50AM MDT
Summary:
The state began to dry out yesterday underneath a northwesterly flow regime. Early morning fog over the Northeast Plains allowed for weak instability to build over the South Platte River Valley yesterday, which lead to a round of brief thunderstorms during the afternoon. Most of the storms were high-based and quick-paced with very low rainfall totals. The Northeast Plains remained capped, so severe thunderstorms were avoided.
The highest observed rainfall total yesterday was measured in Iliff (Logan County) where 0.25 inches of rain was recorded at a COOP station. Isolated thunderstorms also formed over the eastern Palmer Ridge late yesterday afternoon near the strong moisture gradient with storm totals just over 0.25 inches estimated by MetStorm. Dew points between the Palmer Ridge and the surrounding low laying plains had a difference up to 25°F due to gusty downsloping winds from the higher terrains throughout the morning, which kept totals to the west must lower than east of this boundary. The highest total yesterday was over Cheyenne County where MetStorm estimated just under 0.5 inches of rain.
Some early afternoon showers popped up on radar over the southern San Juan Mountains yesterday with some residual moisture mixing with the daily upslope flow regime. Showers also lingered over Archuleta, Hinsdale and Mineral Counties throughout the afternoon, but surface accumulations were only trace amounts. Therefore, these storms mostly produced cloud cover with plenty of virga. Some additional weak storms moved in over the Northwest Slope from the UT/WY border, but weak forcing and low moisture kept rainfall totals to trace amounts as well. Dry air underneath the base of the storm lead to some strong outflow winds with 45 and 50 mph gusts recorded at ASOS stations near Craig (eastern Moffat County) and Silt (central Garfield County), respectively.
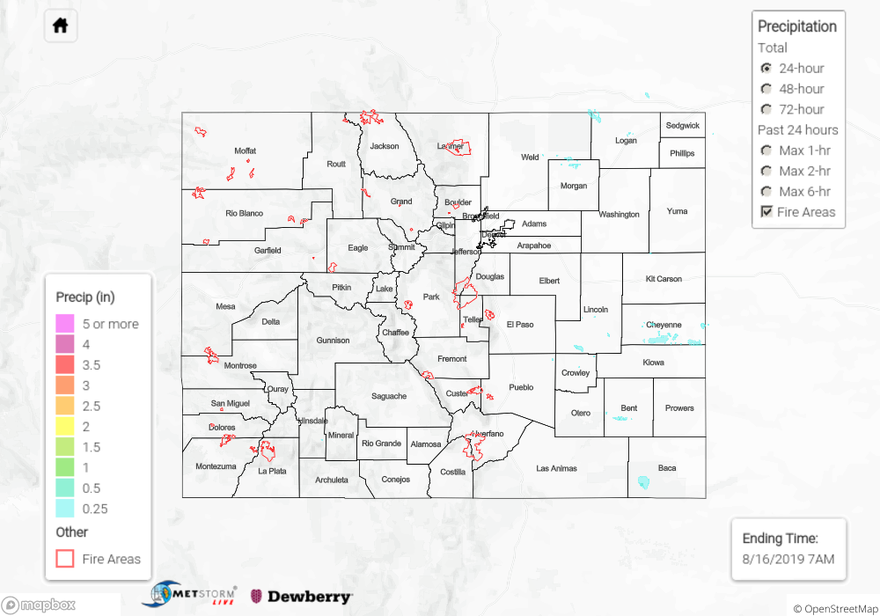
For a look at precipitation over your area, please visit the State Precipitation Map below.
Click Here For Map Overview