SPM 08-29-2019: Weak Storms Break the Cap Over the Eastern Plains

Issue Date: Thursday, August 29th, 2019
Issue Time: 10:10AM MDT

Summary:

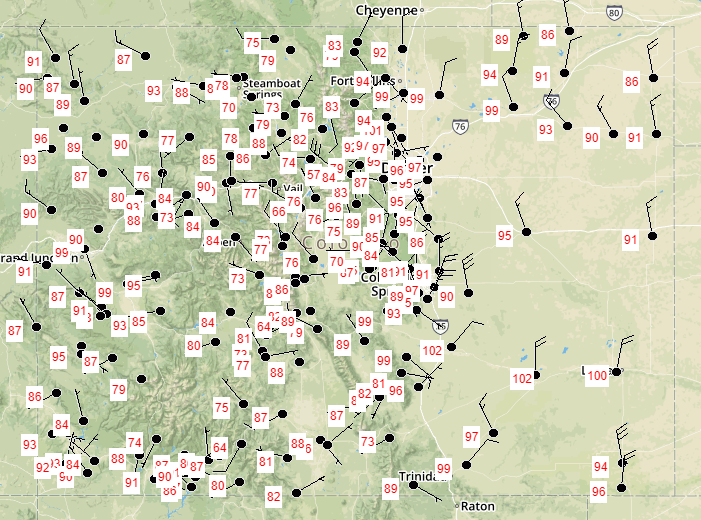
It didn’t take long for temperatures to rebound after the cool down with highs increasing as much as 10°F over the Northeast Plains. A dry air mass over the state kept the majority of the state rain free. Surface winds amplified during the afternoon hours, and a Red Flag Warning was issued for Moffat County and portions of the high terrains. The Shawnee Mountain fire became a bit more active, but firefighers were still able to make good progress reinforcing firelines. The Middle Mamm fire started by lightning on July 28th also continues to burn, but it is being managed closely (semi-controlled burn) to improve forecast health. It has currently burned 209 acres with no structures threatened. The Berthoud Pass ASOS recorded a 35 mph gust with RAWS stations recorded more general gusts in the 20-25 mph range according to MesoWest.

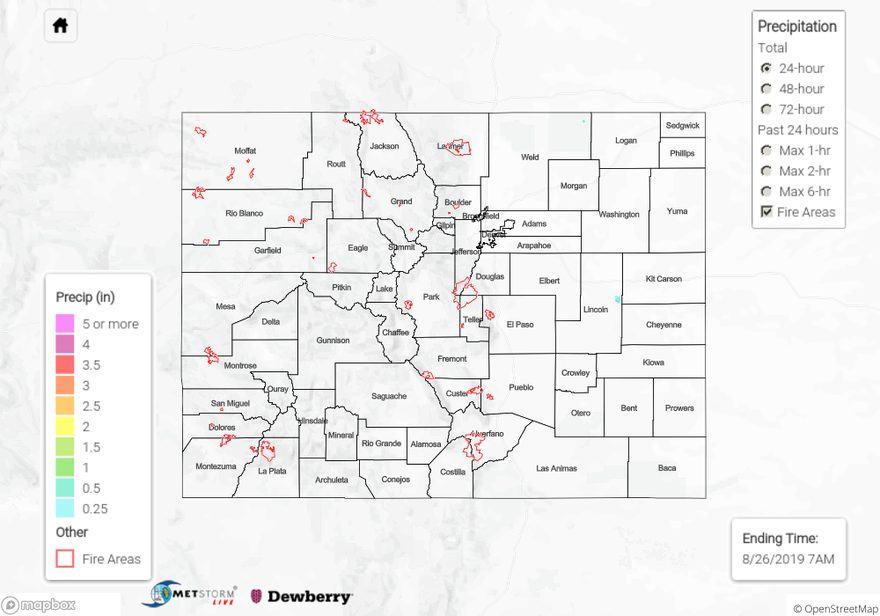
Storms were able to break the cap along a dryline that set up over the eastern plains. While the slight chance of storms was forecast was for Baca County, storms popped just after 3:30PM over Yuma and Kit Carson Counties. As the storm dived south into Kit Carson County, it was able to drop some impressive storm totals due to dew points in the upper 50°Fs and low 60°Fs. MetStorm estimated an isolated area of rainfall up to 2 inches for the storm total. The storm dissipated just after 7:30PM, and there were no reports of flooding or hail as of this morning.

To see estimated precipitation totals over your neighborhood on Wednesday, scroll down the State Precipitation Map below.

Click Here For Map Overview

The map below shows radar-estimated, rainfall gage-adjusted Quantitative Precipitation Estimates (QPE) across Colorado. The map is updated daily during the operational season (May 1 – Sep 30) by 11AM. The following six layers are currently available: 24-hour, 48-hour and 72-hour total precipitation, as well as maximum 1-hour, 2-hour and 6-hour precipitation over the past 24 hour period (to estimate where flash flooding may have occurred). The 24-hour, 48-hour and 72-hour total precipitation contain bias corrections that are not disaggregated into the hourly estimates, so there will likely be some differences. The accumulation ending time is 7AM of the date shown in the bottom right corner. Also shown optionally are vulnerable fire burn areas (post 2012), which are updated throughout the season to include new, vulnerable burn areas. The home button in the top left corner resets the map to the original zoom.

SPM 08-28-2019: Cool Temperatures & Weak Storms for the Raton Ridge and Northeast Plains

Issue Date: Wednesday, August 28th, 2019
Issue Time: 9:40AM MDT

Summary:

As forecast, there were a few pockets of weak storms and showers yesterday over the Northeast Plains and the Raton Ridge. Storms began over the Northeast Plains yesterday morning around 8 AM along a convergence boundary (cold front) that roughly followed I-76, and showers were also supported by the upper level jet. Rainfall started light and increased in intensity as the sun helped create some instability. Weak thunderstorms began to form by 11am and moved into southwest Nebraska by 1:45 PM. Dry air aloft and weak instability (due to the morning cloud cover) kept rainfall totals light with a CoCoRaHS station measuring only 0.15 inches in eastern Yuma County. MetStorm estimates up to 0.75 inches fell in the cores of these storms.

Storms tried to initiate over Teller County, similar to Monday, but lack of lift didn’t allow the cap to break. Thunderstorms over the Raton Ridge had better luck breaking the cap, but high bases kept accumulations light. Convection began over southern Costilla County around 2 PM. Weak northwesterly steering flows pushed the area of convection over the western Raton Ridge midway through the afternoon where a couple rounds of weak storms passed through. Storms stayed south of the Spring Creek burn area, and MetStorm estimated 0.25 inches of rainfall in the storm cores.

High temperatures continued to slightly decrease as another cold front dropped through the state during the morning into the afternoon and continued the northerly surface flow. Highs were as low as the upper 60°Fs over portions of the Northeast Plains, which was reinforced by rain cooled air. Over the west, highs dropped another 3°F to 5°F with the highest NWS ASOS temperature recorded over Delta, CO (95°F). Dry air continued to be pushed into the area, which dropped relative humidity into the single digits and kept the area rain free.

For a look at precipitation over your area, please visit the State Precipitation Map below.

Click Here For Map Overview

The map below shows radar-estimated, rainfall gage-adjusted Quantitative Precipitation Estimates (QPE) across Colorado. The map is updated daily during the operational season (May 1 – Sep 30) by 11AM. The following six layers are currently available: 24-hour, 48-hour and 72-hour total precipitation, as well as maximum 1-hour, 2-hour and 6-hour precipitation over the past 24 hour period (to estimate where flash flooding may have occurred). The 24-hour, 48-hour and 72-hour total precipitation contain bias corrections that are not disaggregated into the hourly estimates, so there will likely be some differences. The accumulation ending time is 7AM of the date shown in the bottom right corner. Also shown optionally are vulnerable fire burn areas (post 2012), which are updated throughout the season to include new, vulnerable burn areas. The home button in the top left corner resets the map to the original zoom.

SPM 08-27-2019: Isolated Storm over the Raton Ridge

Issue Date: Tuesday, August 27th, 2019
Issue Time: 9:50AM MDT

Summary:

Almost all of the state remained dry again with cooler high temperatures recorded statewide. Upslope flow over the Raton Ridge mixed with some residual moisture and generated a severe thunderstorm last night around 7:30PM. Storm motion to the southeast kept the storm from tracking over the Spring Creek burn area with the highest accumulations over the Raton Ridge. Radar derived up to 0.48 inches of rainfall over a two hour period, and a CoCoRaHS station near Trinidad measured 0.39 inches of rain for the 24-hour total. Similarly, a RAWS station in western Las Animas County near the Tercio Ranch Airstrip measured 0.36 inches in an hour.

As forecast, high temperatures dropped off yesterday by as much as 20°F over the Northeast Plains and Urban Corridor. Most of the region failed to break the 80°F mark in the wake of a strong cold front that moved through yesterday morning. The front produced some gusty winds as it pushed south with Pueblo Airport reporting a gust just under 40mph. Back to the west, highs over the southwest quadrant of the state remained a little warmer. High temperatures reached into the 80°Fs and 90°Fs over the region.

For a look at precipitation over your area, please visit the State Precipitation Map

Click Here For Map Overview

The map below shows radar-estimated, rainfall gage-adjusted Quantitative Precipitation Estimates (QPE) across Colorado. The map is updated daily during the operational season (May 1 – Sep 30) by 11AM. The following six layers are currently available: 24-hour, 48-hour and 72-hour total precipitation, as well as maximum 1-hour, 2-hour and 6-hour precipitation over the past 24 hour period (to estimate where flash flooding may have occurred). The 24-hour, 48-hour and 72-hour total precipitation contain bias corrections that are not disaggregated into the hourly estimates, so there will likely be some differences. The accumulation ending time is 7AM of the date shown in the bottom right corner. Also shown optionally are vulnerable fire burn areas (post 2012), which are updated throughout the season to include new, vulnerable burn areas. The home button in the top left corner resets the map to the original zoom.

SPM 08-26-2019: Hot and Windy Weather Continues

Issue Date: Monday, August 26th, 2019
Issue Time: 10:20AM MDT

Summary:

Hot and dry weather was realized statewide yesterday with multiple high temperature records broken. Colorado Springs and Pueblo both broke their high temperature records measuring 97°F and 102°F, respectively. Grand Junction tied its high temperature record measuring 99°F. For a look at high temperatures over your area please see the MesoWest map below.

Critical fire conditions increased yesterday with a large area of northwest CO and the mountains under a Red Flag Warning. Widespread wind gusts between 30 and 40 mph were measured yesterday afternoon over northern Colorado as the pressure gradient tightened from the passing trough. Wind gusts up to 59 mph were measured over Berthoud Pass around 1PM. Two small fires did ignite yesterday within the Red Flag Warning area, but both are fully suppressed at this time. The West Magnolia Fire was reported near Nederland in Boulder County and the Gutpile Fire near Montrose in Montrose County. Both fires burned less than 1 acre.

As far as precipitation, it was dry yesterday with no CoCoRaHS stations reporting any rainfall. Radar derived rainfall up to 0.1 inches over the central San Juan Mountains and northeast Weld County, but most of this was likely virga. Radar derived a small area up to 0.3 inches of rain in northern Lincoln County; however, this is likely an attenuation error in the radar data.

For a look at precipitation over your area the last 72-hours, please visit the State Precipitation Map below.

Click Here For Map Overview

The map below shows radar-estimated, rainfall gage-adjusted Quantitative Precipitation Estimates (QPE) across Colorado. The map is updated daily during the operational season (May 1 – Sep 30) by 11AM. The following six layers are currently available: 24-hour, 48-hour and 72-hour total precipitation, as well as maximum 1-hour, 2-hour and 6-hour precipitation over the past 24 hour period (to estimate where flash flooding may have occurred). The 24-hour, 48-hour and 72-hour total precipitation contain bias corrections that are not disaggregated into the hourly estimates, so there will likely be some differences. The accumulation ending time is 7AM of the date shown in the bottom right corner. Also shown optionally are vulnerable fire burn areas (post 2012), which are updated throughout the season to include new, vulnerable burn areas. The home button in the top left corner resets the map to the original zoom.