Issue Date: Thursday, August 29th, 2019
Issue Time: 10:10AM MDT
Summary:
It didn’t take long for temperatures to rebound after the cool down with highs increasing as much as 10°F over the Northeast Plains. A dry air mass over the state kept the majority of the state rain free. Surface winds amplified during the afternoon hours, and a Red Flag Warning was issued for Moffat County and portions of the high terrains. The Shawnee Mountain fire became a bit more active, but firefighers were still able to make good progress reinforcing firelines. The Middle Mamm fire started by lightning on July 28th also continues to burn, but it is being managed closely (semi-controlled burn) to improve forecast health. It has currently burned 209 acres with no structures threatened. The Berthoud Pass ASOS recorded a 35 mph gust with RAWS stations recorded more general gusts in the 20-25 mph range according to MesoWest.
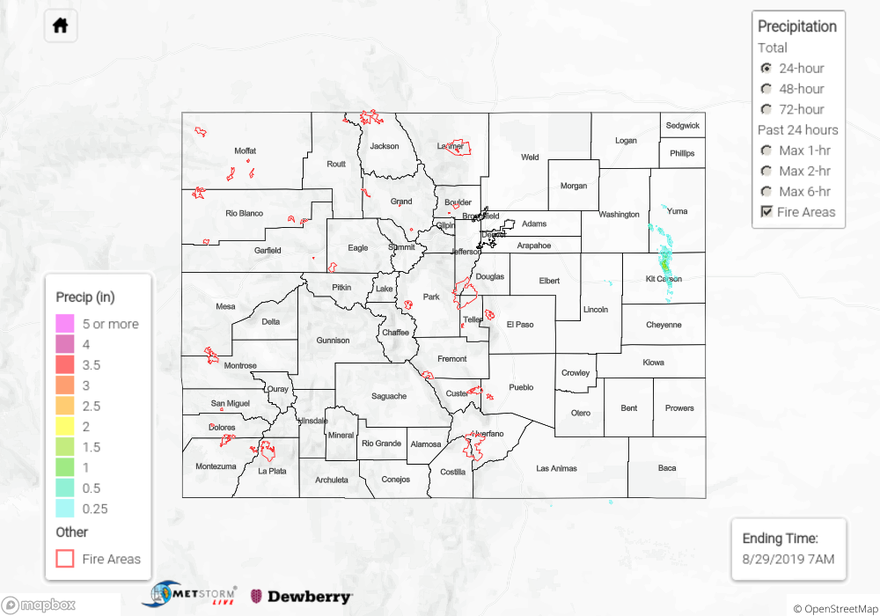
Storms were able to break the cap along a dryline that set up over the eastern plains. While the slight chance of storms was forecast was for Baca County, storms popped just after 3:30PM over Yuma and Kit Carson Counties. As the storm dived south into Kit Carson County, it was able to drop some impressive storm totals due to dew points in the upper 50°Fs and low 60°Fs. MetStorm estimated an isolated area of rainfall up to 2 inches for the storm total. The storm dissipated just after 7:30PM, and there were no reports of flooding or hail as of this morning.
To see estimated precipitation totals over your neighborhood on Wednesday, scroll down the State Precipitation Map below.
