Issue Date: Monday, August 26th, 2019
Issue Time: 10:20AM MDT
Summary:
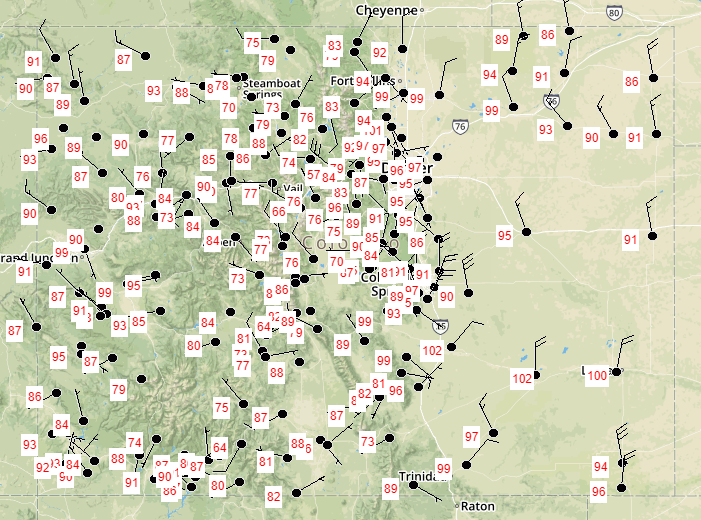
Hot and dry weather was realized statewide yesterday with multiple high temperature records broken. Colorado Springs and Pueblo both broke their high temperature records measuring 97°F and 102°F, respectively. Grand Junction tied its high temperature record measuring 99°F. For a look at high temperatures over your area please see the MesoWest map below.
Critical fire conditions increased yesterday with a large area of northwest CO and the mountains under a Red Flag Warning. Widespread wind gusts between 30 and 40 mph were measured yesterday afternoon over northern Colorado as the pressure gradient tightened from the passing trough. Wind gusts up to 59 mph were measured over Berthoud Pass around 1PM. Two small fires did ignite yesterday within the Red Flag Warning area, but both are fully suppressed at this time. The West Magnolia Fire was reported near Nederland in Boulder County and the Gutpile Fire near Montrose in Montrose County. Both fires burned less than 1 acre.
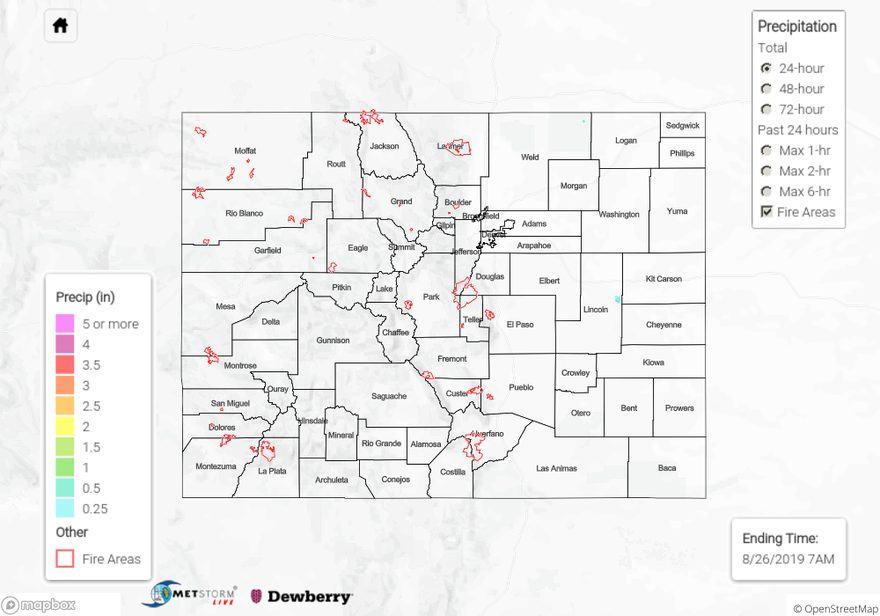
As far as precipitation, it was dry yesterday with no CoCoRaHS stations reporting any rainfall. Radar derived rainfall up to 0.1 inches over the central San Juan Mountains and northeast Weld County, but most of this was likely virga. Radar derived a small area up to 0.3 inches of rain in northern Lincoln County; however, this is likely an attenuation error in the radar data.
For a look at precipitation over your area the last 72-hours, please visit the State Precipitation Map below.
Click Here For Map Overview