Issue Date: Tuesday, August 27th, 2019
Issue Time: 9:50AM MDT
Summary:
Almost all of the state remained dry again with cooler high temperatures recorded statewide. Upslope flow over the Raton Ridge mixed with some residual moisture and generated a severe thunderstorm last night around 7:30PM. Storm motion to the southeast kept the storm from tracking over the Spring Creek burn area with the highest accumulations over the Raton Ridge. Radar derived up to 0.48 inches of rainfall over a two hour period, and a CoCoRaHS station near Trinidad measured 0.39 inches of rain for the 24-hour total. Similarly, a RAWS station in western Las Animas County near the Tercio Ranch Airstrip measured 0.36 inches in an hour.
As forecast, high temperatures dropped off yesterday by as much as 20°F over the Northeast Plains and Urban Corridor. Most of the region failed to break the 80°F mark in the wake of a strong cold front that moved through yesterday morning. The front produced some gusty winds as it pushed south with Pueblo Airport reporting a gust just under 40mph. Back to the west, highs over the southwest quadrant of the state remained a little warmer. High temperatures reached into the 80°Fs and 90°Fs over the region.
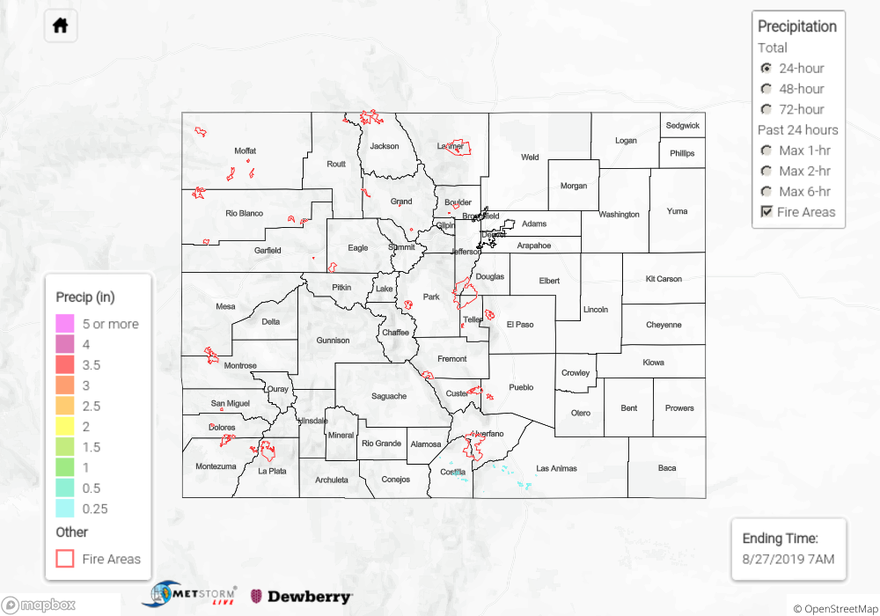
For a look at precipitation over your area, please visit the State Precipitation Map
Click Here For Map Overview