Issue Date: Wednesday, August 28th, 2019
Issue Time: 9:40AM MDT
Summary:
As forecast, there were a few pockets of weak storms and showers yesterday over the Northeast Plains and the Raton Ridge. Storms began over the Northeast Plains yesterday morning around 8 AM along a convergence boundary (cold front) that roughly followed I-76, and showers were also supported by the upper level jet. Rainfall started light and increased in intensity as the sun helped create some instability. Weak thunderstorms began to form by 11am and moved into southwest Nebraska by 1:45 PM. Dry air aloft and weak instability (due to the morning cloud cover) kept rainfall totals light with a CoCoRaHS station measuring only 0.15 inches in eastern Yuma County. MetStorm estimates up to 0.75 inches fell in the cores of these storms.
Storms tried to initiate over Teller County, similar to Monday, but lack of lift didn’t allow the cap to break. Thunderstorms over the Raton Ridge had better luck breaking the cap, but high bases kept accumulations light. Convection began over southern Costilla County around 2 PM. Weak northwesterly steering flows pushed the area of convection over the western Raton Ridge midway through the afternoon where a couple rounds of weak storms passed through. Storms stayed south of the Spring Creek burn area, and MetStorm estimated 0.25 inches of rainfall in the storm cores.
High temperatures continued to slightly decrease as another cold front dropped through the state during the morning into the afternoon and continued the northerly surface flow. Highs were as low as the upper 60°Fs over portions of the Northeast Plains, which was reinforced by rain cooled air. Over the west, highs dropped another 3°F to 5°F with the highest NWS ASOS temperature recorded over Delta, CO (95°F). Dry air continued to be pushed into the area, which dropped relative humidity into the single digits and kept the area rain free.
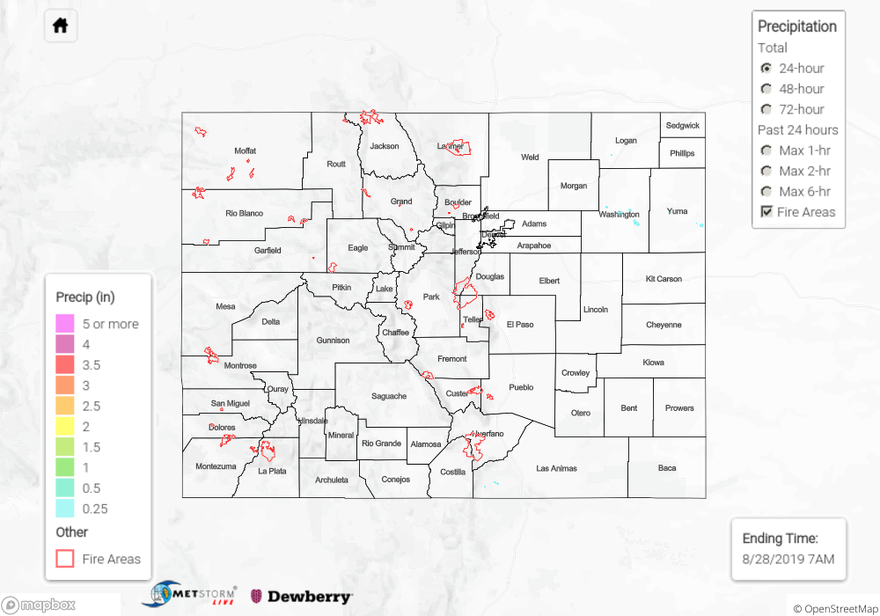
For a look at precipitation over your area, please visit the State Precipitation Map below.
Click Here For Map Overview