SPM 09-06-2019: Rinse and Repeat with Garden Variety Showers and Thunderstorms

Issue Date: Friday, September 6th, 2019
Issue Time: 10:15AM MDT

Summary:

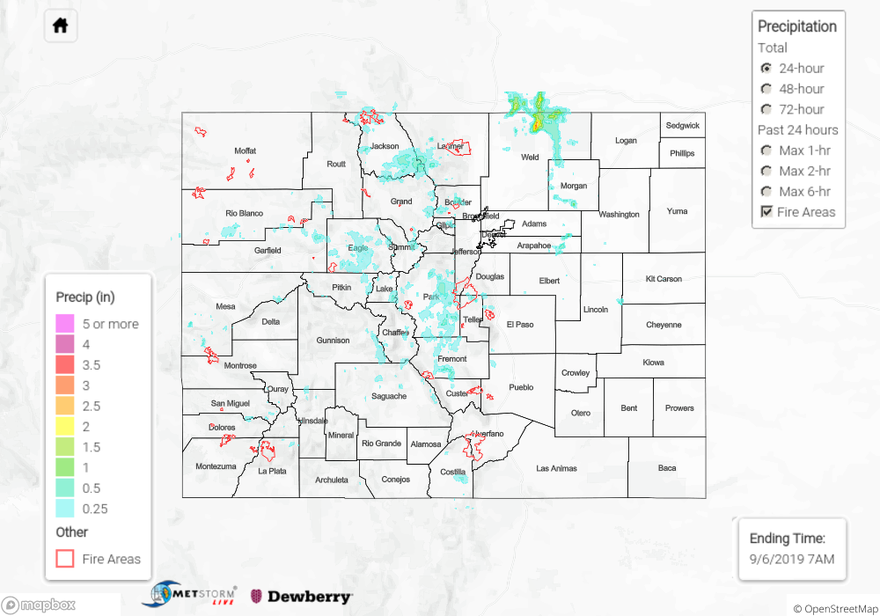
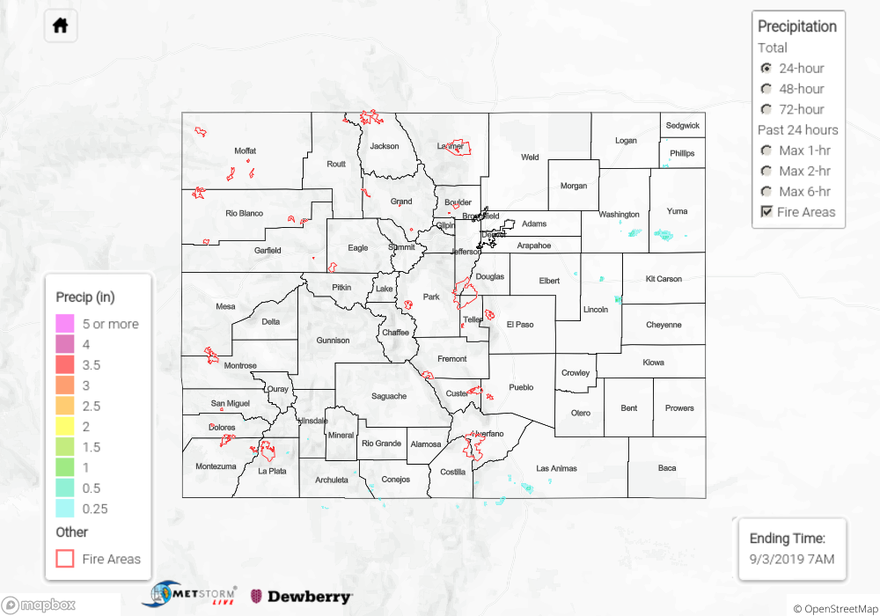
Similar set up to Wednesday on Thursday with a shortwave helping produce more widespread showers over the mountains during the afternoon. As storms moved off the mountains to the northeast, they became capped over the eastern plains. There was some better moisture in the adjacent plains for heavier rainfall, but coverage dropped off. The strongest Severe Thunderstorm storm of the day was over Weld County where MetStrom bias corrected (not shown below due to errors in yesterday’s QPE) had 1-hour rain rates around 1.5 inches. The Boulder Radar was out, but the Cheyenne radar wasn’t too far from the storms, so totals around 1.5 inches seems about right near Grover. Over the mountains, the highest totals were along the Continental Divide in Gunnison/Chaffee Counties. Totals were estimated at just over an inch with a RAWS site at Huntsman Mesa recording 0.25 inches. Two nearby SNOTEL states recorded 0.3 inches (Sargents Mesa and Porphyry Creek). Flooding was not reported.

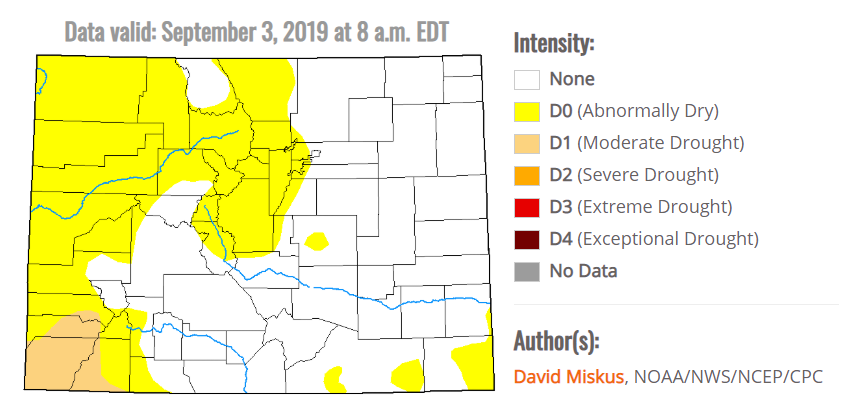
The drought situation is worsening over western Colorado and especially over southwest Colorado (Dolores, Montezuma, La Plata Counties). Almost all of the counties in the Northwest/Southwest Slope, Grand Valley and Northern Mountains are now Abnormally Dry (D0 category). The area size of the D0-D1 drought has increased 21% from the last map release on August 27th. That is now a total of 41% of the state’s area. The area size of the Moderate Drought (D1 category) has increased by 1.5% since the last map release. Hopefully the wetting rains this weekend will start to chip away at the dry conditions.

To see estimated precipitation totals over your neighborhood on Thursday, scroll down to the State Precipitation Map below.

Click Here For Map Overview

The map below shows radar-estimated, rainfall gage-adjusted Quantitative Precipitation Estimates (QPE) across Colorado. The map is updated daily during the operational season (May 1 – Sep 30) by 11AM. The following six layers are currently available: 24-hour, 48-hour and 72-hour total precipitation, as well as maximum 1-hour, 2-hour and 6-hour precipitation over the past 24 hour period (to estimate where flash flooding may have occurred). The accumulation ending time is 7AM of the date shown in the bottom right corner. Also shown optionally are vulnerable fire burn areas (post 2012), which are updated throughout the season to include new, vulnerable burn areas. The home button in the top left corner resets the map to the original zoom.

Note: The 24-hour, 48-hour and 72-hour total precipitation do not contain bias corrections today due to errors in the CoCoRaHS data. This means there may be underestimations in QPE over the southwest and southeast corners of the state.

SPM 09-05-2019: Isolated Thunderstorms over the Southern Front Range and Palmer Ridge

Issue Date: Thursday, September 5th, 2019
Issue Time: 10:40AM MDT

Summary:

Afternoon storm coverage increased over the high country yesterday as a shortwave embedded within the high pressure ridge made its way over the state from the west. Lower levels of moisture near the surface over the higher elevations kept surface accumulation on the lighter side for the western mountain ranges. Rainfall increased towards the Continental Divide where there was a better moisture pool from the previous day’s rainfall and cold front on Tuesday. Chaffee County had the highest surface measurements for the mountains yesterday reporting between 0.12 and 0.42 inches over the area.  Radar derived just above 0.25 inches over the San Juan Mountains and Southwest Slope with 0.23 inches measured by a COOP station over Red Mountain Pass.

Over the Front Range, cumulus began to sprout around 11am and storms moved into the adjacent plains around noon with the westerly flow aloft. The strongest storm formed near Colorado Springs and moved east over the Palmer Ridge with the upper level flow. Enhanced convergence over the elevated terrain and better moisture allowed storms to produce higher rain rates. Localized heavy rain was reported to the north of Monument in El Paso County with 0.9 inches of rain falling in 30 minutes. Mesonets throughout northern El Paso County and southern Douglas County reported as much as 0.98 inches with most totals between 0.20 and 0.45 inches of rain. Radar derived isolated 1-hour rainfall rates up to 1.33 inches and 1.18 inches over western and eastern Elbert County, respectively.

Outflow boundaries helped regenerate the storms as they moved east, but a stronger cap over the far eastern border counties caused the storms to dissipate and produce some gusty winds before they could reach the Kansas border. Wind gusts up to 35 mph were reported near Seibert in western Cheyenne County, which produced a dust storm that limited visibility to a quarter mile during the evening hours. The Limon airport had southerly winds in the 15 to 20 mph range yesterday afternoon and a strong outflow boundary from a thunderstorm moving through around 6PM. A gust of 50mph was recorded at the airport, so I’m sure this helped produce the dust storm as it moved east.

To see estimated precipitation totals over your neighborhood on Wednesday, scroll down to the State Precipitation Map below.

Click Here For Map Overview

The map below shows radar-estimated, rainfall gage-adjusted Quantitative Precipitation Estimates (QPE) across Colorado. The map is updated daily during the operational season (May 1 – Sep 30) by 11AM. The following six layers are currently available: 24-hour, 48-hour and 72-hour total precipitation, as well as maximum 1-hour, 2-hour and 6-hour precipitation over the past 24 hour period (to estimate where flash flooding may have occurred). The accumulation ending time is 7AM of the date shown in the bottom right corner. Also shown optionally are vulnerable fire burn areas (post 2012), which are updated throughout the season to include new, vulnerable burn areas. The home button in the top left corner resets the map to the original zoom.

Note: The 24-hour, 48-hour and 72-hour total precipitation do not contain bias corrections today due to errors in the CoCoRaHS data. This means there may be underestimations in QPE over the southwest and southeast corners of the state.

SPM 09-04-2019: Overnight, Heavy Rainfall for Park County and Flash Flooding over the Spring Creek Burn Area

Issue Date: Wednesday, September 4th, 2019
Issue Time: 9:50AM MDT

Summary:

A passing cold front helped cool off the hot start to September on Tuesday morning. Behind the front, highs dropped between 5 and 15°F depending on the location. There was some great moisture return behind the front (relative to where it was) and dew points reached the 50°Fs across the eastern plains. Post frontal upslope flow helped kick off thunderstorms over the mountains first over the San Juans, and then west over the Front Range. Storms really got going over the Front Range just after 5PM. Several rounds of nearly stationary storms from 7PM to 2AM over southern Park County caused some very high totals. A CoCoRaHS station 7 miles west of Lake George, CO (Pike National Forest) recorded 2.38 inches for the 24-hour period. This is a fairly remote area, so not a ton of observations. Another RAWS station near Lake George recorded 0.79 inches of rainfall with other RAWS stations over the Pike National Forest ranging from 0.13 to 0.40 inches. MetStorm estimated around 2.75 inches west of Lake George (over Eleven Mile State Park) with 1-hour rain rates up to 1.6 inches. As much as 1.75 inches fell over the Hayman-Teller burn area (2002), but flooding was not reported as of this morning. Over southern Fremont County, 0.8 inches was recorded with this set of storms.

Late night storms also popped up over the Southeast Mountains although they were more isolated in coverage. A Flash Flood Warning was issued for the Spring Creek burn area at 11PM. At this time emergency management was reporting heavy rainfall across the area, and by 11:23PM flash flooding was occurring along Middle Creek within the burn area. MetStorm indicates between 1.5 and 1.75 inches fell just west of La Veta with no other observations where the radar was showing this reflectivity. Totals over western Colorado (San Juans and Northern Mountains) reached up to 0.2 inches with most areas receiving below 0.1 inches.

To see estimated precipitation totals over your neighborhood on Tuesday, scroll down to the State Precipitation Map below.

Click Here For Map Overview

The map below shows radar-estimated, rainfall gage-adjusted Quantitative Precipitation Estimates (QPE) across Colorado. The map is updated daily during the operational season (May 1 – Sep 30) by 11AM. The following six layers are currently available: 24-hour, 48-hour and 72-hour total precipitation, as well as maximum 1-hour, 2-hour and 6-hour precipitation over the past 24 hour period (to estimate where flash flooding may have occurred). The 24-hour, 48-hour and 72-hour total precipitation contain bias corrections that are not disaggregated into the hourly estimates, so there will likely be some differences. The accumulation ending time is 7AM of the date shown in the bottom right corner. Also shown optionally are vulnerable fire burn areas (post 2012), which are updated throughout the season to include new, vulnerable burn areas. The home button in the top left corner resets the map to the original zoom.

SPM 09-03-2019: Monthly Record Breaking High Temperatures Achieved Again for Labor Day

Issue Date: Tuesday, September 3rd, 2019
Issue Time: 10:20AM MDT

Summary:

It was a scorcher out there yesterday with another day of record breaking heat recorded statewide for the Labor Day holiday. Shown below is a map of the large dome of high pressure (500 mb height contour) over the four corners region, which is anomalously strong for this time of year. Thus, it’s not surprising several areas under the ridge had record breaking or near record breaking heat. The map below shows those heat records with a legend in the bottom left corner describing what they represent. Areas of northern Colorado and the eastern plains broke the heat record for the month of September (pink circles) along with numerous tying daily high records over the state (orange circles). A couple of the pink circles were monthly records that were re-broken from Sunday. The highest temperature recorded yesterday was over the Southeast Plains where it measured 106°F at Lamar Municipal Airport. Highs reached into the 100°Fs over the Grand Valley, Urban Corridor, Northeast Plains and Southeast Plains.

As far as precipitation goes most of the state remained dry with relative humidity dropping into the teens and single digits.  Mid-level moisture within westerly flow lead to some light but persistent high based showers over the high elevations of the San Juan Mountains.  A few thunderstorms also popped up over the eastern Palmer Ridge and Raton Ridge just after noon and moved over the adjacent plains a little later in the afternoon.  Surface measurements of rainfall remained very low with the highest 24-hour total measured by a CoCoRaHS station in southwestern Yuma County of 0.09 inches.  Radar derived  isolated totals just over 0.5 inches in Las Animas, Yuma and Washington Counties. Note, the total over 1 inch in eastern Lincoln County is not accurate.

For a look at rainfall over your area, please visit the State Precipitation Map below which does not contain the bias correction today.  Note that the 72-hour total will not be available until tomorrow due to an outage over the weekend.

Click Here For Map Overview

The map below shows radar-estimated, rainfall gage-adjusted Quantitative Precipitation Estimates (QPE) across Colorado. The map is updated daily during the operational season (May 1 – Sep 30) by 11AM. The following six layers are currently available: 24-hour, 48-hour and 72-hour total precipitation, as well as maximum 1-hour, 2-hour and 6-hour precipitation over the past 24 hour period (to estimate where flash flooding may have occurred). The accumulation ending time is 7AM of the date shown in the bottom right corner. Also shown optionally are vulnerable fire burn areas (post 2012), which are updated throughout the season to include new, vulnerable burn areas. The home button in the top left corner resets the map to the original zoom.

Note: The 24-hour, 48-hour and 72-hour total precipitation do not contain bias corrections today due to errors in the CoCoRaHS data. This means there may be underestimations in QPE over the southwest and southeast corners of the state.