Issue Date: Wednesday, September 4th, 2019
Issue Time: 9:50AM MDT
Summary:
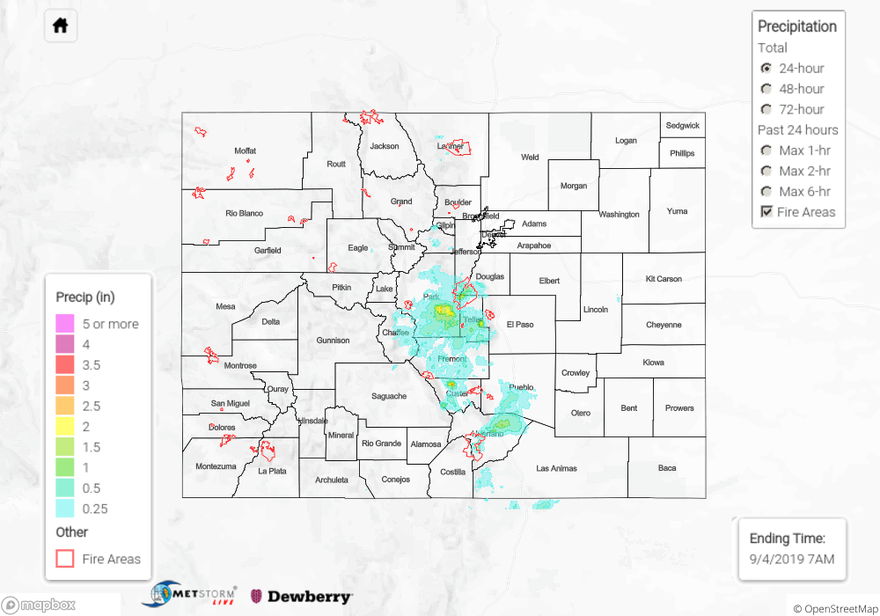
A passing cold front helped cool off the hot start to September on Tuesday morning. Behind the front, highs dropped between 5 and 15°F depending on the location. There was some great moisture return behind the front (relative to where it was) and dew points reached the 50°Fs across the eastern plains. Post frontal upslope flow helped kick off thunderstorms over the mountains first over the San Juans, and then west over the Front Range. Storms really got going over the Front Range just after 5PM. Several rounds of nearly stationary storms from 7PM to 2AM over southern Park County caused some very high totals. A CoCoRaHS station 7 miles west of Lake George, CO (Pike National Forest) recorded 2.38 inches for the 24-hour period. This is a fairly remote area, so not a ton of observations. Another RAWS station near Lake George recorded 0.79 inches of rainfall with other RAWS stations over the Pike National Forest ranging from 0.13 to 0.40 inches. MetStorm estimated around 2.75 inches west of Lake George (over Eleven Mile State Park) with 1-hour rain rates up to 1.6 inches. As much as 1.75 inches fell over the Hayman-Teller burn area (2002), but flooding was not reported as of this morning. Over southern Fremont County, 0.8 inches was recorded with this set of storms.
Late night storms also popped up over the Southeast Mountains although they were more isolated in coverage. A Flash Flood Warning was issued for the Spring Creek burn area at 11PM. At this time emergency management was reporting heavy rainfall across the area, and by 11:23PM flash flooding was occurring along Middle Creek within the burn area. MetStorm indicates between 1.5 and 1.75 inches fell just west of La Veta with no other observations where the radar was showing this reflectivity. Totals over western Colorado (San Juans and Northern Mountains) reached up to 0.2 inches with most areas receiving below 0.1 inches.
To see estimated precipitation totals over your neighborhood on Tuesday, scroll down to the State Precipitation Map below.
Click Here For Map Overview