Issue Date: Friday, September 6th, 2019
Issue Time: 10:15AM MDT
Summary:
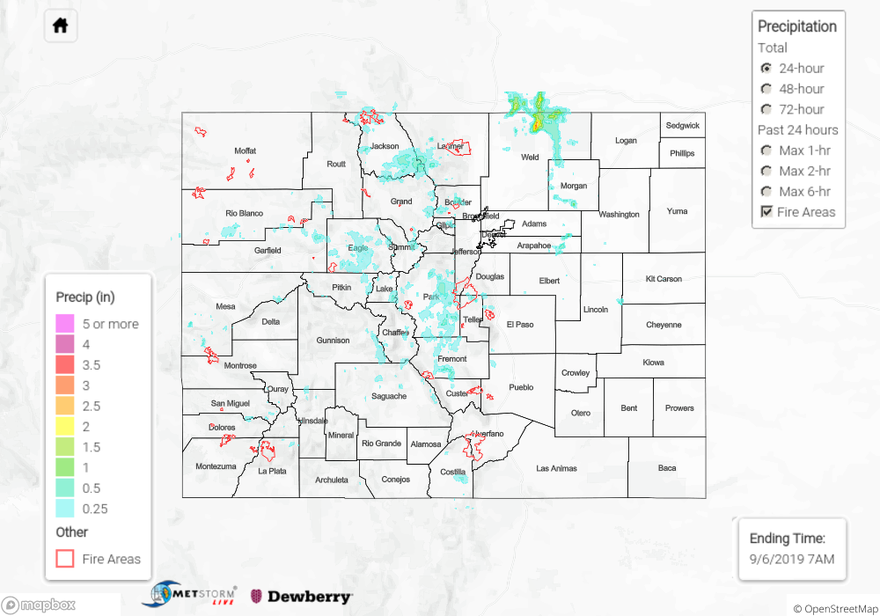
Similar set up to Wednesday on Thursday with a shortwave helping produce more widespread showers over the mountains during the afternoon. As storms moved off the mountains to the northeast, they became capped over the eastern plains. There was some better moisture in the adjacent plains for heavier rainfall, but coverage dropped off. The strongest Severe Thunderstorm storm of the day was over Weld County where MetStrom bias corrected (not shown below due to errors in yesterday’s QPE) had 1-hour rain rates around 1.5 inches. The Boulder Radar was out, but the Cheyenne radar wasn’t too far from the storms, so totals around 1.5 inches seems about right near Grover. Over the mountains, the highest totals were along the Continental Divide in Gunnison/Chaffee Counties. Totals were estimated at just over an inch with a RAWS site at Huntsman Mesa recording 0.25 inches. Two nearby SNOTEL states recorded 0.3 inches (Sargents Mesa and Porphyry Creek). Flooding was not reported.
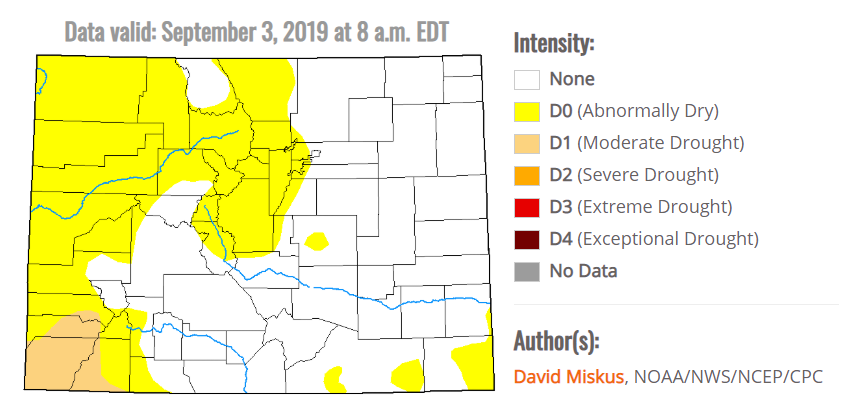
The drought situation is worsening over western Colorado and especially over southwest Colorado (Dolores, Montezuma, La Plata Counties). Almost all of the counties in the Northwest/Southwest Slope, Grand Valley and Northern Mountains are now Abnormally Dry (D0 category). The area size of the D0-D1 drought has increased 21% from the last map release on August 27th. That is now a total of 41% of the state’s area. The area size of the Moderate Drought (D1 category) has increased by 1.5% since the last map release. Hopefully the wetting rains this weekend will start to chip away at the dry conditions.
To see estimated precipitation totals over your neighborhood on Thursday, scroll down to the State Precipitation Map below.
Click Here For Map Overview
Note: The 24-hour, 48-hour and 72-hour total precipitation do not contain bias corrections today due to errors in the CoCoRaHS data. This means there may be underestimations in QPE over the southwest and southeast corners of the state.

