SPM 05-04-2020: Evening and Overnight Severe Thunderstorms for the Northeast Plains and Palmer Ridge

Issue Date: Monday, May 4th, 2020
Issue Time: 9:55AM MDT

Summary:

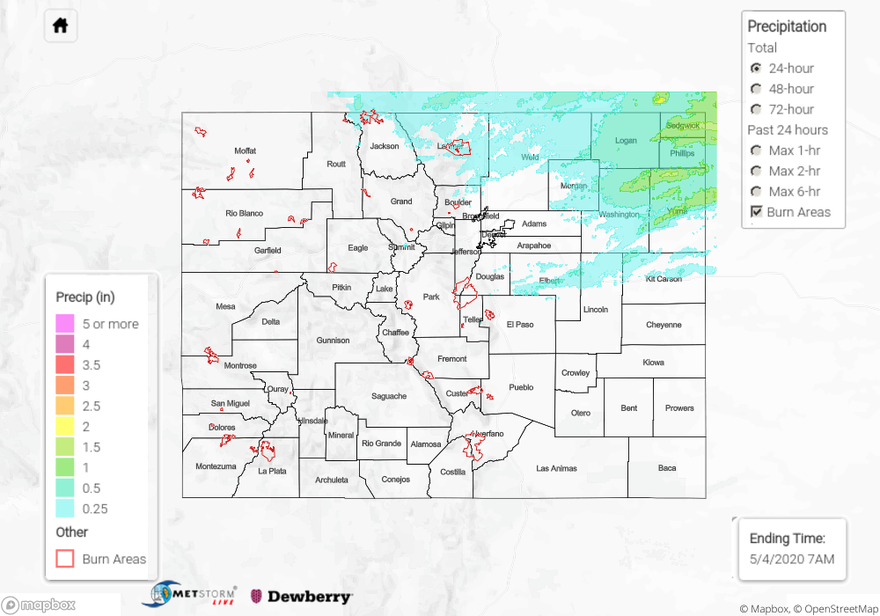
Rinse and repeat pattern with additional overnight thunderstorms on Sunday into Monday. More moisture and CAPE available in the atmosphere allowed for some stronger thunderstorms. Isolated storms first fired over the Northeast Plains and Palmer Ridge in the late afternoon. Hail up to 1 inch in diameter was reported on a Severe Thunderstorm in Elbert County. Rainfall totals for the 24-hour period were estimated at just under 2 inches in the area. More widespread and multiple rounds of thunderstorms developed around 9PM through this morning for the Palmer Ridge and Northeast Plains. A 1.75 inch diameter hail stone was reported at 11PM in Sterling, CO associated with a severe thunderstorm. 24-hour totals were just under 2 inches in northern Yuma, Phillips and Sedgwick Counties. No flooding was reported, and this was definitely a nice wetting rain for the crops.

Out west, strong winds were reported again in Northwest Colorado. Two 50 mph wind reports came out of Garfield and Meeker Airports around 2PM yesterday afternoon. The Wyman fire continues to burn in southwest Routt County (18 miles SW of Hayden) and is currently 380 acres. Hazy conditions may be experienced in Pagoda, Hayden and Craig although winds picking up from the northwest may help disperse the smoke away.

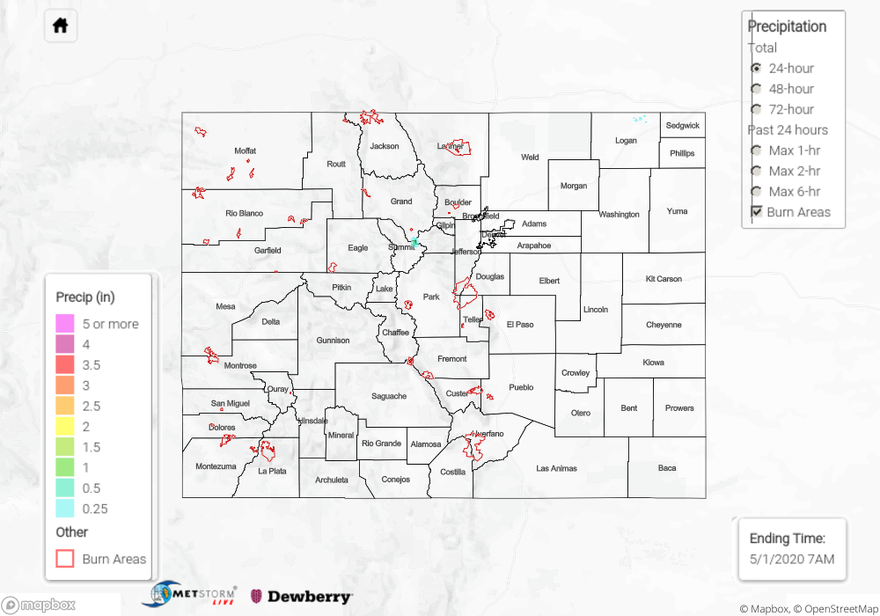
For precipitation estimates in your neighborhood on Sunday, scroll down to the State Precipitation Map below.

Click Here For Map Overview

The map below shows radar-estimated, rainfall gage-adjusted Quantitative Precipitation Estimates (QPE) across Colorado. The map is updated daily during the operational season (May 1 – Sep 30) by 11AM. The following six layers are currently available: 24-hour, 48-hour and 72-hour total precipitation, as well as maximum 1-hour, 2-hour and 6-hour precipitation over the past 24 hour period (to estimate where flash flooding may have occurred). The 24-hour, 48-hour and 72-hour total precipitation contain bias corrections that are not disaggregated into the hourly estimates, so there will likely be some differences. The accumulation ending time is 7AM of the date shown in the bottom right corner. Also shown optionally are vulnerable fire burn areas (post 2012), which are updated throughout the season to include new, vulnerable burn areas. The home button in the top left corner resets the map to the original zoom.

SPM 05-03-2020: Scattered Thunderstorms Rumbled Across Northern Colorado

Issue Date: Sunday, May 2nd, 2020
Issue Time: 9:20 AM MDT

Summary:

An increase in moisture worked with a passing disturbance to produce scattered showers/thunderstorms across the northern half of Colorado yesterday. Showers and thunderstorms got started around lunchtime, beginning as garden-variety activity, with a few stronger storms mixing in during the late afternoon and evening hours. These stronger storms produced two severe reports: 1-inch hail in Rio Blanco County, and 65 mph wind gust in Arapahoe County.

Showers and thunderstorms came to an end around sunset over the mountains, with a few light flurries continuing over the highest elevations of the Northern Mountains into the early morning hours. East of the mountains, thunderstorms rumbled into the nighttime, with activity ending over the Urban Corridor between 10 and 11 PM, and exiting the state to the east just after midnight.

Flooding was not reported on Saturday. For rainfall estimates in your area, check out our State Precipitation Map below.

Click Here For Map Overview

The map below shows radar-estimated, rainfall gage-adjusted Quantitative Precipitation Estimates (QPE) across Colorado. The map is updated daily during the operational season (May 1 – Sep 30) by 11AM. The following six layers are currently available: 24-hour, 48-hour and 72-hour total precipitation, as well as maximum 1-hour, 2-hour and 6-hour precipitation over the past 24 hour period (to estimate where flash flooding may have occurred). The 24-hour, 48-hour and 72-hour total precipitation contain bias corrections that are not disaggregated into the hourly estimates, so there will likely be some differences. The accumulation ending time is 7AM of the date shown in the bottom right corner. Also shown optionally are vulnerable fire burn areas (post 2012), which are updated throughout the season to include new, vulnerable burn areas. The home button in the top left corner resets the map to the original zoom.

SPM 05-02-2020: A Dose of Early Summer

Issue Date: Saturday, May 2nd, 2020
Issue Time: 9:30 AM MDT

Summary:

Colorado was given a dose of early summer yesterday, with high temperatures well above average across the state. Grand Junction, for example, tied the daily record high temperature set back in 1943 and 2001 at 88° F. As the day marched on into the afternoon and evening hours, a mid-level disturbance scraped across northern Colorado, kicking off scattered high-based showers and thunderstorms across the Northwest Slope, Northern Mountains, and northern portions of the Front Range. Shower activity diminished slowly after sunset, and aside from a light sprinkle or two over the highest peaks of the Northern Mountains, all activity came to an end by 5 AM this morning.

Further to the east, a surface cool front accompanied by some low-level moisture, worked with the disturbance to develop high-based scattered showers and thunderstorms during the afternoon and evening across the Urban Corridor and Northeast Plains. Still, a general lack of moisture below cloud bases resulted in mainly gusty winds and light rain, with plenty of virga. Shower and thunderstorm activity diminished after sunset, with a few showers lingering into the early morning hours.

Flooding was not reported on Friday. For rainfall estimates in your area, check out our State Precipitation Map below.

Click Here For Map Overview

The map below shows radar-estimated, rainfall gage-adjusted Quantitative Precipitation Estimates (QPE) across Colorado. The map is updated daily during the operational season (May 1 – Sep 30) by 11AM. The following six layers are currently available: 24-hour, 48-hour and 72-hour total precipitation, as well as maximum 1-hour, 2-hour and 6-hour precipitation over the past 24 hour period (to estimate where flash flooding may have occurred). The 24-hour, 48-hour and 72-hour total precipitation contain bias corrections that are not disaggregated into the hourly estimates, so there will likely be some differences. The accumulation ending time is 7AM of the date shown in the bottom right corner. Also shown optionally are vulnerable fire burn areas (post 2012), which are updated throughout the season to include new, vulnerable burn areas. The home button in the top left corner resets the map to the original zoom.

SPM 05-01-2020: Light Rainfall Accumulations for Northwest Colorado

Issue Date: Friday, May 1st, 2020
Issue Time: 9:15AM MDT

Summary:

With Colorado under the influence of an upper level ridge yesterday, there were quite a few “hot” high temperatures. Most of the state was near or at their daily record high with monthly high temperatures being tied or exceeded a couple places along the Urban Corridor and in the San Luis Valley. Pueblo reached 93F and Grand Junction 89F. As an upper level trough moved across the state yesterday afternoon and overnight, northern Colorado received some light precipitation with the scattered storms. The highest totals were between 0.10 and 0.20 inches over the Northwest Slope and Northern Mountains, and the far northeast corner of the state received about the same. It was also quite windy yesterday afternoon with a report of a 56mph gust in Craig at 3:45PM MDT. Low temperatures overnight were quite warm as well. Lamar and Holyoke ASOS stations barely dropped below 60F. As anticipated, flooding was not reported.

Above is the climatology for the month of April (precip – top; temperature – bottom). Overall, southwest Colorado and the Southeast Mountains were rather dry when compared to climatology. The Urban Corridor fared well thanks to those last set of snow storms. The upper elevations of the Northern, Central, and San Juan Mountains also were quite dry. If you thought April felt warmer than usual, you’re right! Statewide temperatures were all above normal with the Raton and Palmer Ridges much about normal. These warm temperatures definitely helped kick off the melting of the snowpack. More on that in Monday’s FTO.

For precipitation estimates in your neighborhood on Thursday, scroll down to the State Precipitation Map below. Note the 0.5 inches in Summit County is incorrect.

Click Here For Map Overview

The map below shows radar-estimated, rainfall gage-adjusted Quantitative Precipitation Estimates (QPE) across Colorado. The map is updated daily during the operational season (May 1 – Sep 30) by 11AM. The following six layers are currently available: 24-hour, 48-hour and 72-hour total precipitation, as well as maximum 1-hour, 2-hour and 6-hour precipitation over the past 24 hour period (to estimate where flash flooding may have occurred). The 24-hour, 48-hour and 72-hour total precipitation contain bias corrections that are not disaggregated into the hourly estimates, so there will likely be some differences. The accumulation ending time is 7AM of the date shown in the bottom right corner. Also shown optionally are vulnerable fire burn areas (post 2012), which are updated throughout the season to include new, vulnerable burn areas. The home button in the top left corner resets the map to the original zoom.