Issue Date: Friday, May 1st, 2020
Issue Time: 9:15AM MDT
Summary:
With Colorado under the influence of an upper level ridge yesterday, there were quite a few “hot” high temperatures. Most of the state was near or at their daily record high with monthly high temperatures being tied or exceeded a couple places along the Urban Corridor and in the San Luis Valley. Pueblo reached 93F and Grand Junction 89F. As an upper level trough moved across the state yesterday afternoon and overnight, northern Colorado received some light precipitation with the scattered storms. The highest totals were between 0.10 and 0.20 inches over the Northwest Slope and Northern Mountains, and the far northeast corner of the state received about the same. It was also quite windy yesterday afternoon with a report of a 56mph gust in Craig at 3:45PM MDT. Low temperatures overnight were quite warm as well. Lamar and Holyoke ASOS stations barely dropped below 60F. As anticipated, flooding was not reported.
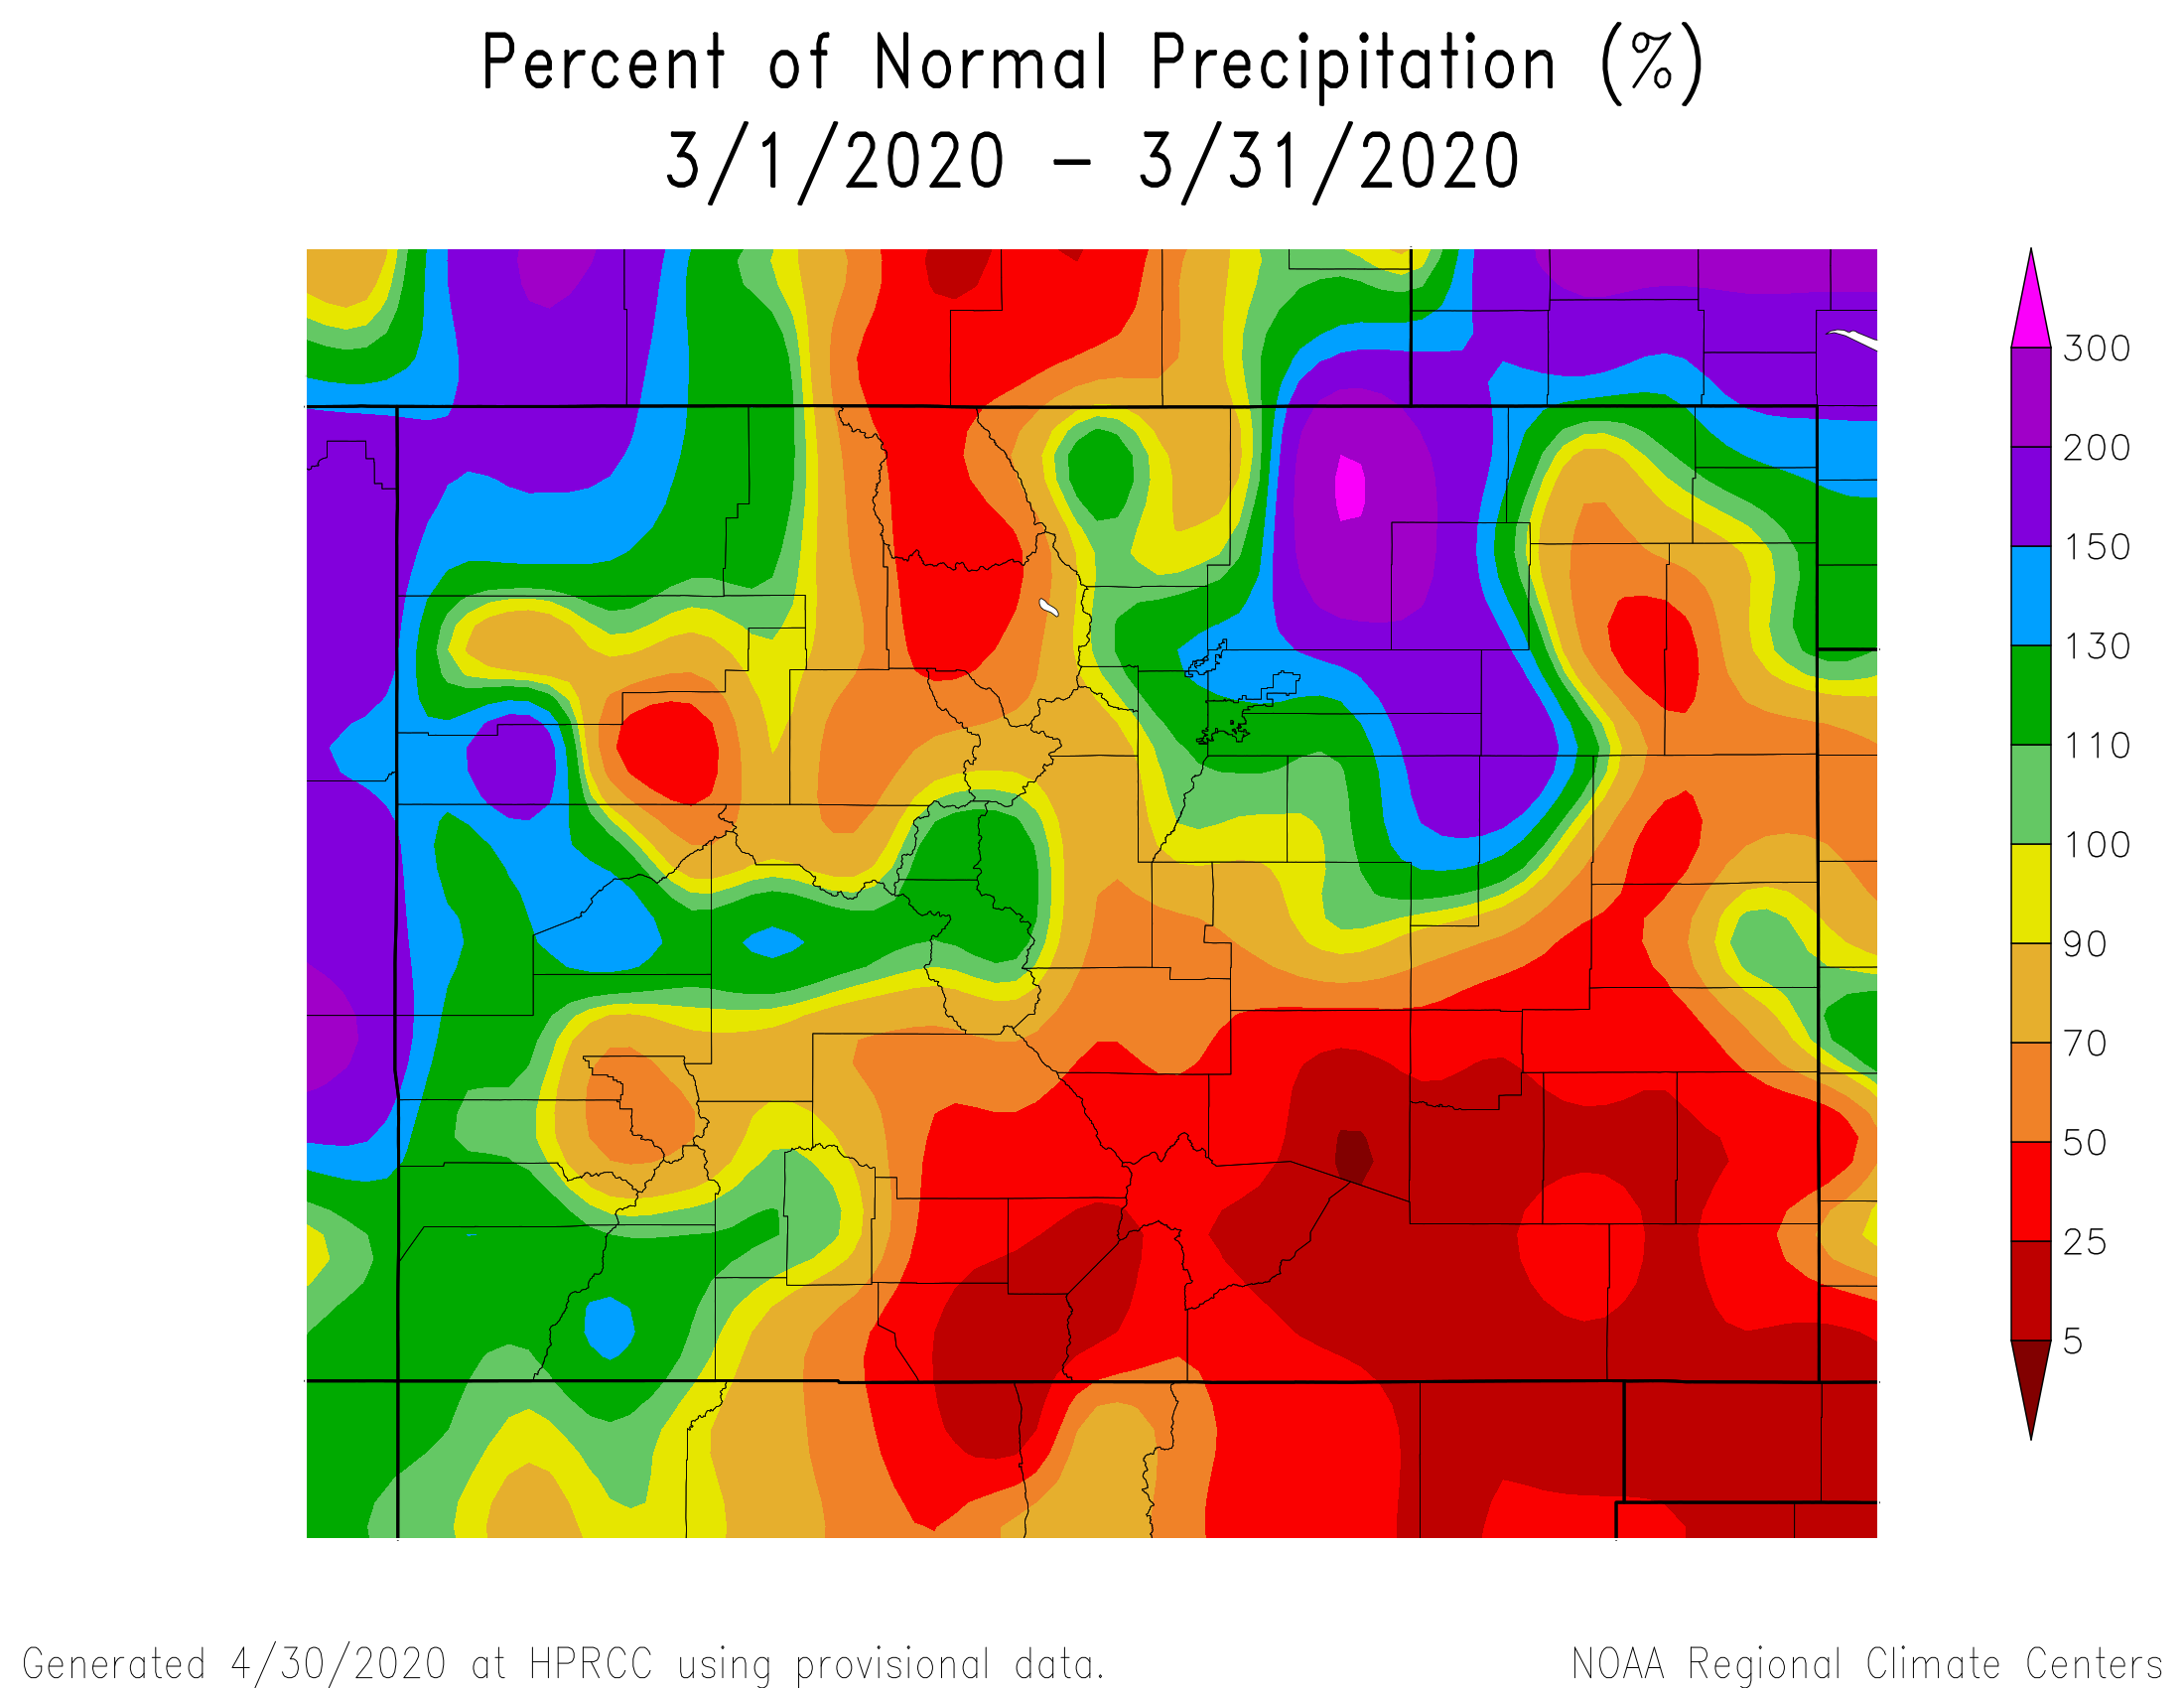
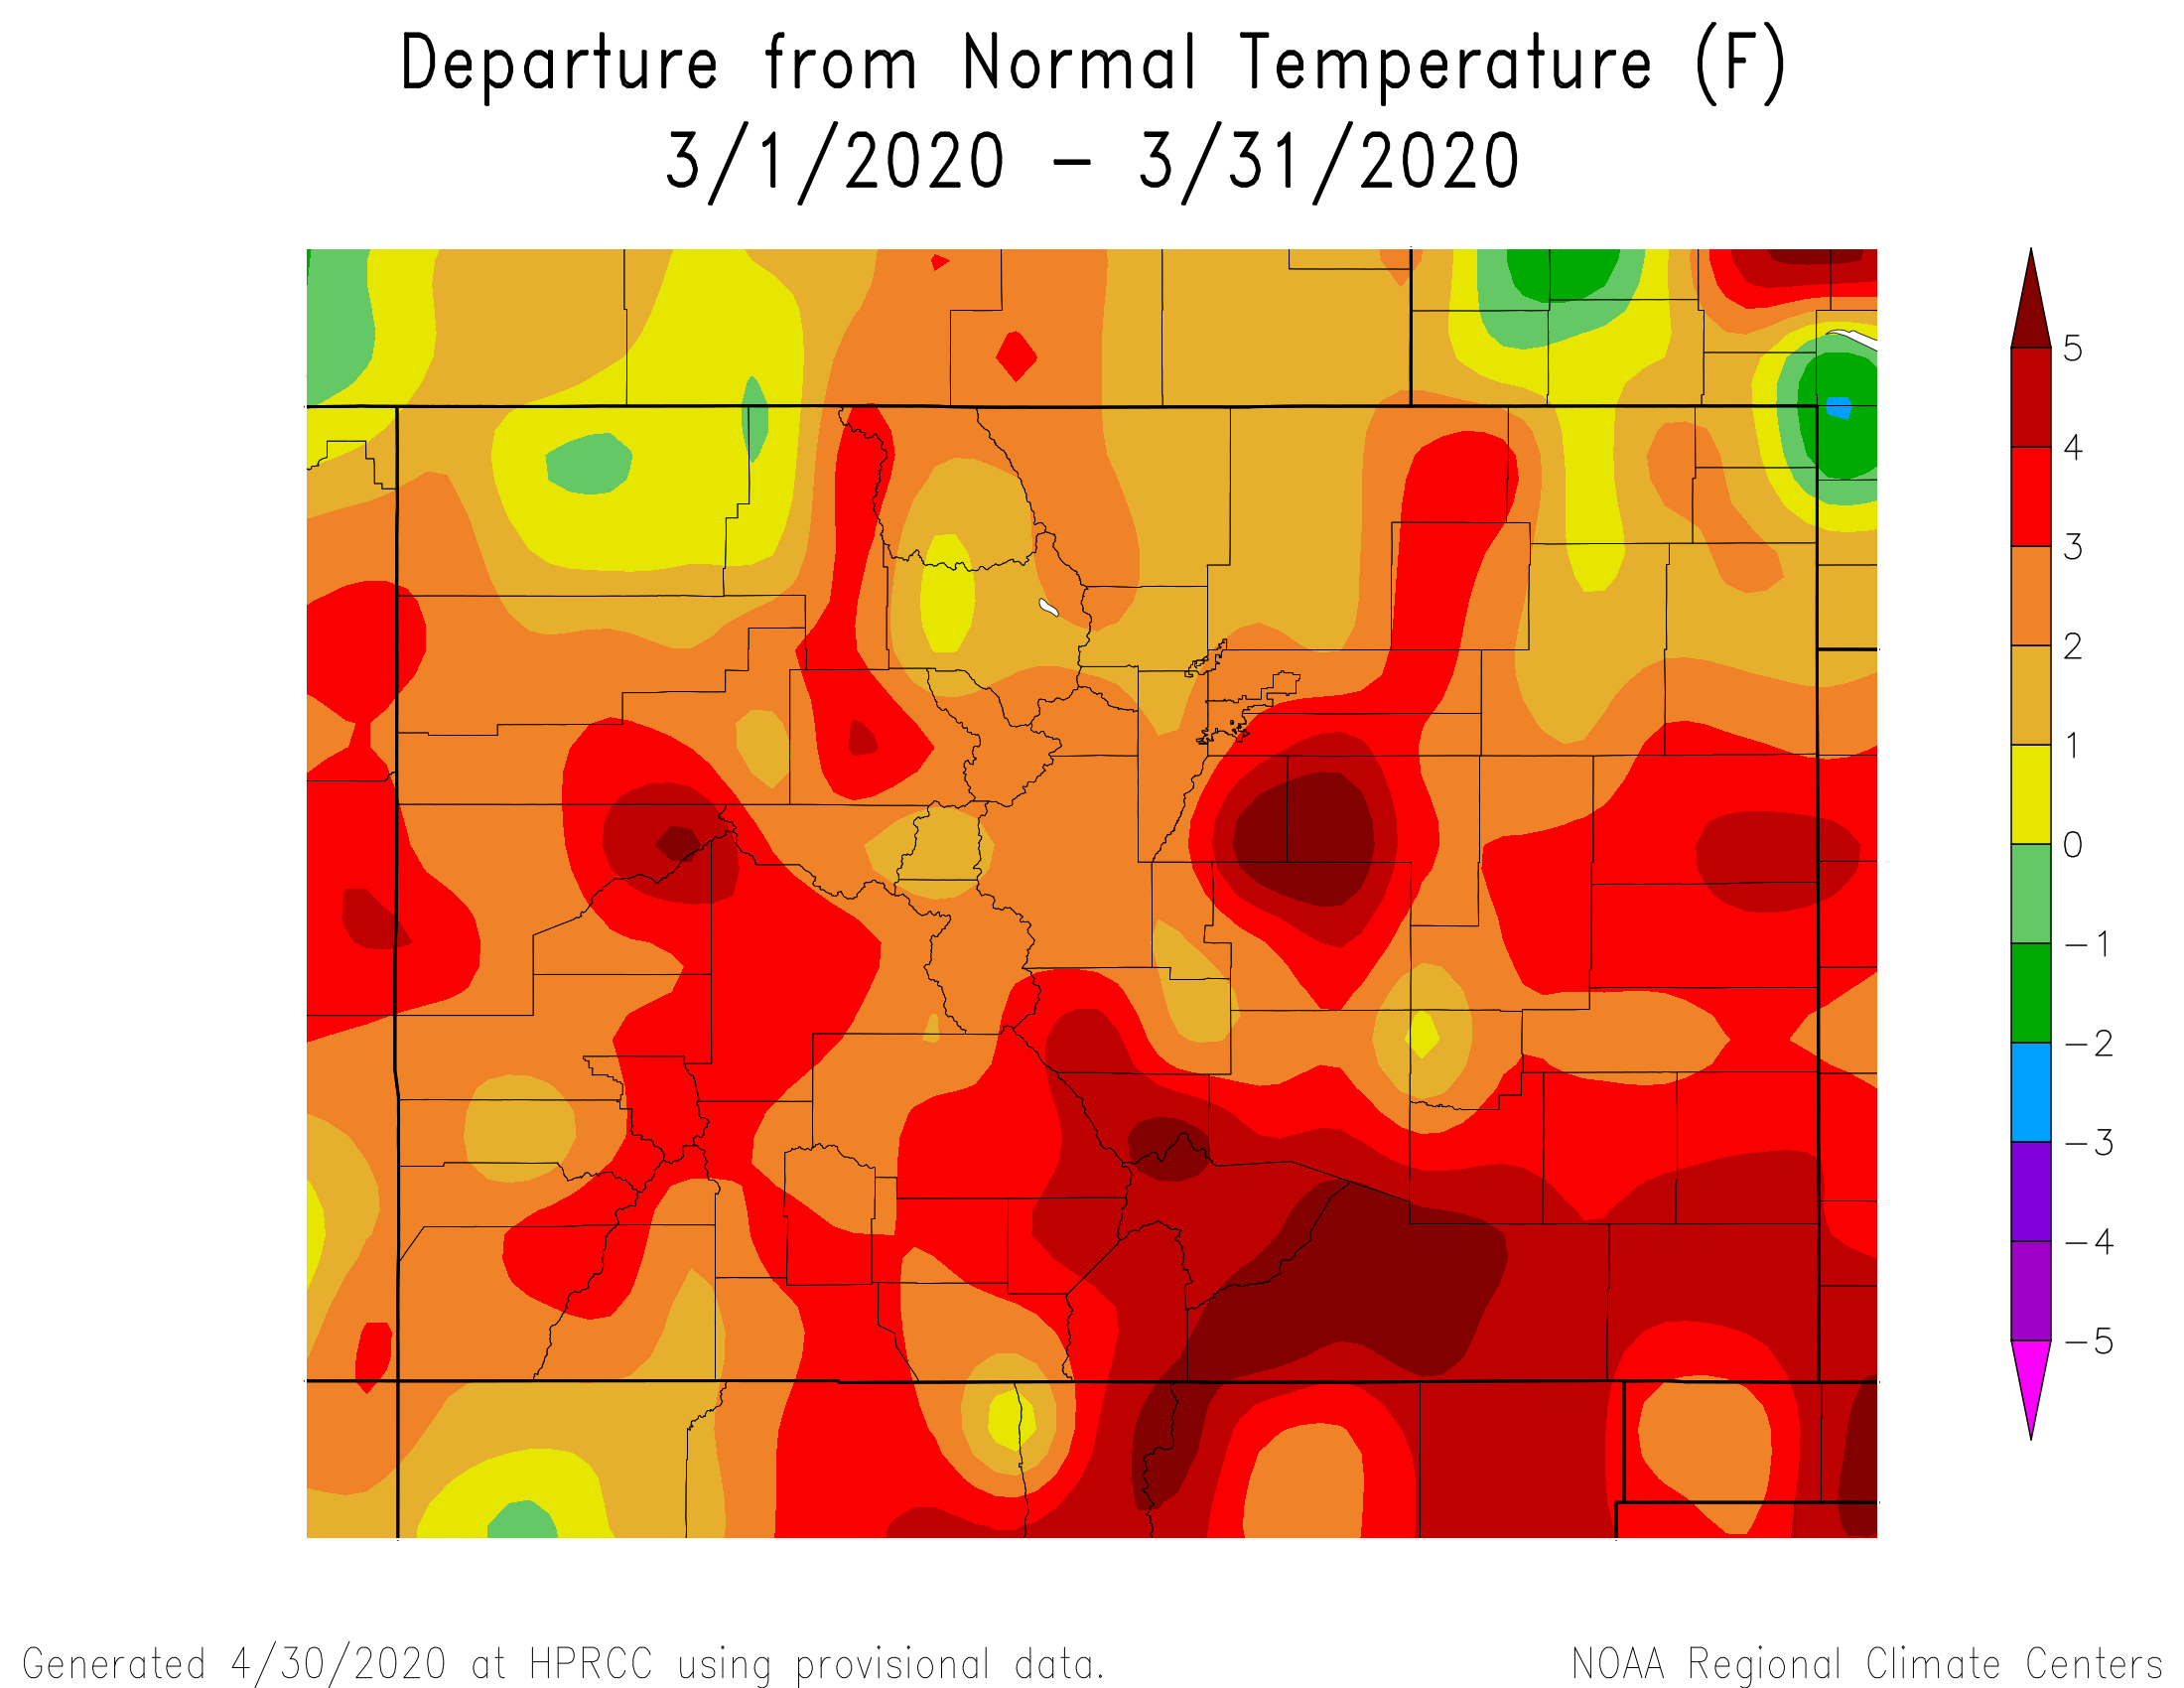
Above is the climatology for the month of April (precip – top; temperature – bottom). Overall, southwest Colorado and the Southeast Mountains were rather dry when compared to climatology. The Urban Corridor fared well thanks to those last set of snow storms. The upper elevations of the Northern, Central, and San Juan Mountains also were quite dry. If you thought April felt warmer than usual, you’re right! Statewide temperatures were all above normal with the Raton and Palmer Ridges much about normal. These warm temperatures definitely helped kick off the melting of the snowpack. More on that in Monday’s FTO.
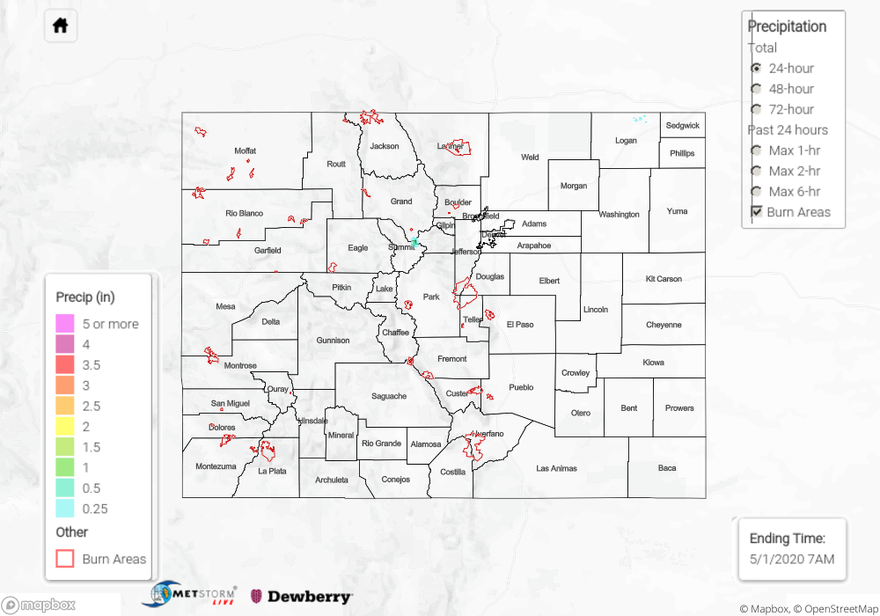
For precipitation estimates in your neighborhood on Thursday, scroll down to the State Precipitation Map below. Note the 0.5 inches in Summit County is incorrect.
Click Here For Map Overview