Issue Date: Saturday, May 2nd, 2020
Issue Time: 9:30 AM MDT
Summary:
Colorado was given a dose of early summer yesterday, with high temperatures well above average across the state. Grand Junction, for example, tied the daily record high temperature set back in 1943 and 2001 at 88° F. As the day marched on into the afternoon and evening hours, a mid-level disturbance scraped across northern Colorado, kicking off scattered high-based showers and thunderstorms across the Northwest Slope, Northern Mountains, and northern portions of the Front Range. Shower activity diminished slowly after sunset, and aside from a light sprinkle or two over the highest peaks of the Northern Mountains, all activity came to an end by 5 AM this morning.
Further to the east, a surface cool front accompanied by some low-level moisture, worked with the disturbance to develop high-based scattered showers and thunderstorms during the afternoon and evening across the Urban Corridor and Northeast Plains. Still, a general lack of moisture below cloud bases resulted in mainly gusty winds and light rain, with plenty of virga. Shower and thunderstorm activity diminished after sunset, with a few showers lingering into the early morning hours.
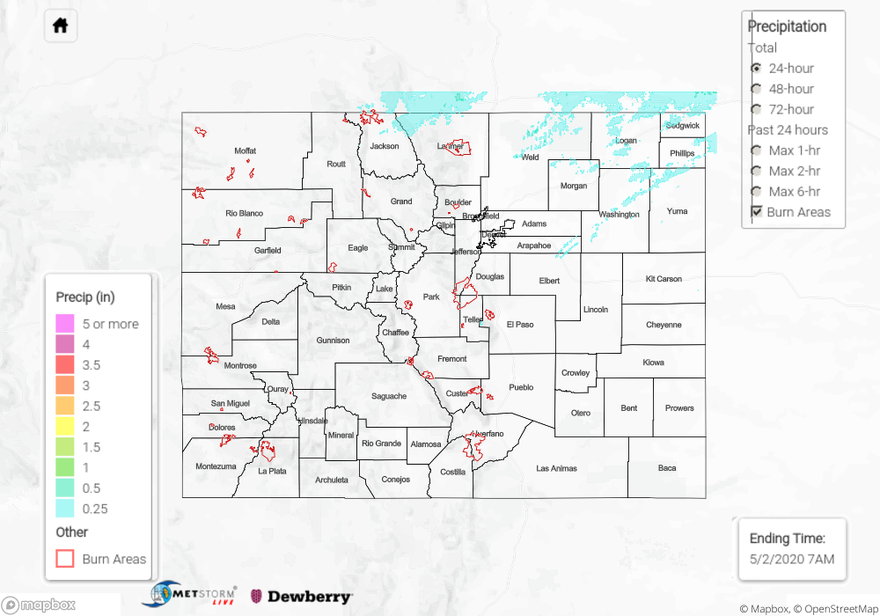
Flooding was not reported on Friday. For rainfall estimates in your area, check out our State Precipitation Map below.
Click Here For Map Overview