SPM 05-08-2020: Gusty Winds and High Fire Danger Continued

Issue Date: Friday, May 8th, 2020
Issue Time: 8:50AM MDT

Summary:

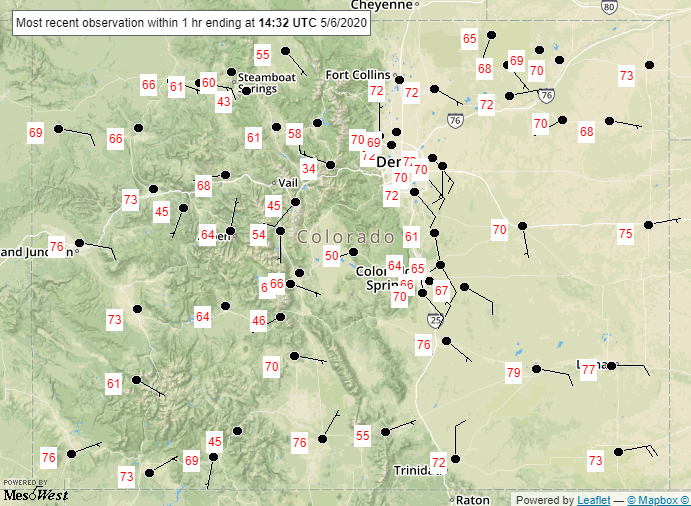
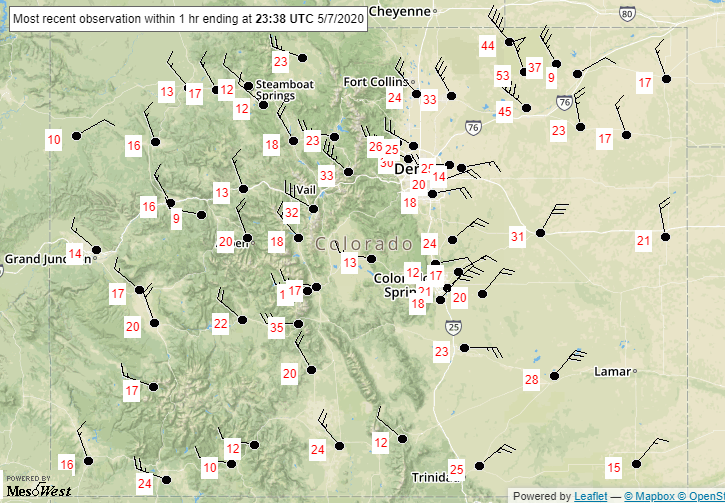
It was a windy afternoon yesterday as the latest low pressure system moved through the area. There were some impressive gusts between yesterday afternoon and evening when the cold front came through. Below are the sustained wind speeds at about 5:30PM when the front was pushing through the Northeast Plains. Grover hit about a 70 mph gust around this time. The fastest reported gust on Thursday was in Boulder at 5:45PM when the NCAR lab ASOS recorded 76 mph. Over western Colorado, peak wind occurred a bit earlier in the afternoon (~2:30PM MDT) with gusts recorded between 35 and 40 mph. The Gunnison AWOS station had the highest report at 43 mph. The increased wind speeds, warm temperatures and low relative humidity meant increased fire danger with a large portion of the state under a Red Flag Warning. As of this morning, thankfully, no new fires have been reported. It was also too dry for any rainfall.


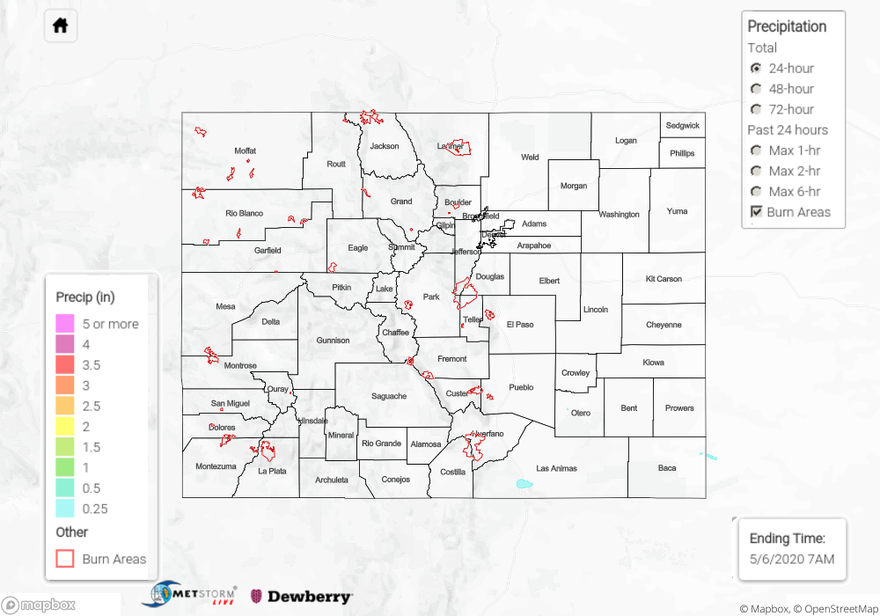
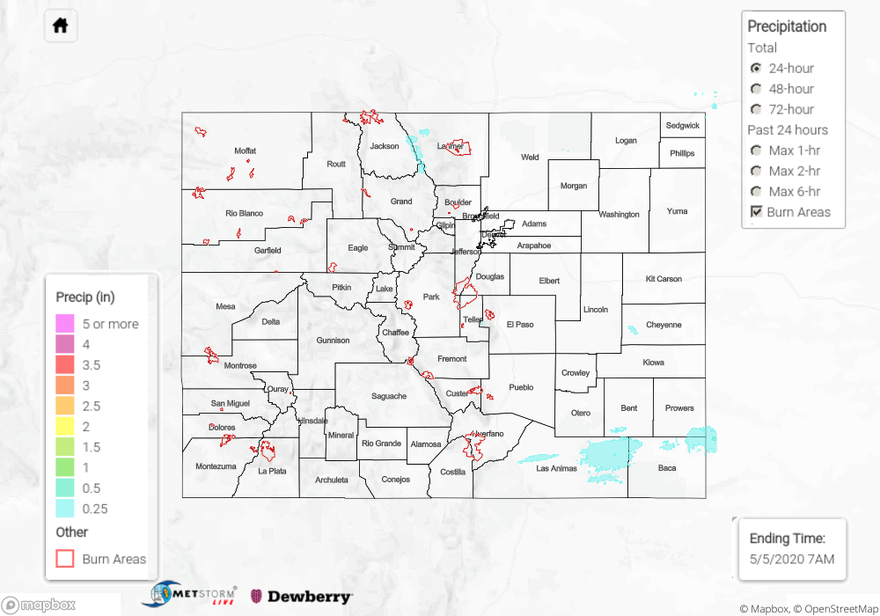
For precipitation estimates in your area over the last 72-hours, scroll down to the State Precipitation Map below.

Click Here For Map Overview

The map below shows radar-estimated, rainfall gage-adjusted Quantitative Precipitation Estimates (QPE) across Colorado. The map is updated daily during the operational season (May 1 – Sep 30) by 11AM. The following six layers are currently available: 24-hour, 48-hour and 72-hour total precipitation, as well as maximum 1-hour, 2-hour and 6-hour precipitation over the past 24 hour period (to estimate where flash flooding may have occurred). The 24-hour, 48-hour and 72-hour total precipitation contain bias corrections that are not disaggregated into the hourly estimates, so there will likely be some differences. The accumulation ending time is 7AM of the date shown in the bottom right corner. Also shown optionally are vulnerable fire burn areas (post 2012), which are updated throughout the season to include new, vulnerable burn areas. The home button in the top left corner resets the map to the original zoom.

SPM 05-07-2020: Warm Temperatures and Elevated Fire Danger for Western Colorado

Issue Date: Thursday, May 7th, 2020
Issue Time: 9:05AM MDT

Summary:

Afternoon temperatures continued their upward trend yesterday despite another cold start Wednesday morning. There were no noteworthy rainfall accumulations across the state, and not a single CoCoRaHS station reported rainfall. It looks like there may have been some light showers over the Northern Mountains in Eagle County. Totals were under 0.05 inches. Fire danger returned to western Colorado and the San Luis Valley yesterday, and a Red Flag Warning was issued. A gust of 46 mph was recorded by the ASOS station in Craig, Colorado.

With all the fire danger the last few days and today, I thought it might be nice to review what constitutes a Red Flag Warning and some other fire weather terminology. Fire danger is usually categorized in a 3-tier system: Elevated, Critical, and Extreme. The difference between the categories has to do with sustained winds (speed and duration), relative humidity, dry fuels and temperatures. Dry fuels refers to ground vegetation’s ability to favor rapid fire growth. For example, brush in an area of drought would be considered high risk for fire growth. More fire terminology can be found HERE.

Red Flag Warnings are issued within 12-24 hours of red flag criteria being met for any 3-hours or more in a 12-hour span. Those criteria are:

1. Frequent gusts of 25 mph or greater AND relative humidity of 15% or less
2. Dry thunderstorms (15% coverage or more)

Other factors in addition to the basic criteria above (or a combination) may result in Red Flag Conditions:

3. Haines Index of 5 or 6, indicating a moderate or high potential for large, plume dominated fire growth
4. Wind shifts associated with frontal passages
5. First significant lightning event (wet or dry) after an extended hot and dry period
6. Poor relative humidity recovery overnight (RH remains at 40% or lower)
7. Any combination of weather and fuel moisture conditions which, in the judgment of the forecaster, would cause extensive wildfire occurrences

For precipitation estimates in over your area the last couple of days, scroll down to the State Precipitation Map below.

Click Here For Map Overview

The map below shows radar-estimated, rainfall gage-adjusted Quantitative Precipitation Estimates (QPE) across Colorado. The map is updated daily during the operational season (May 1 – Sep 30) by 11AM. The following six layers are currently available: 24-hour, 48-hour and 72-hour total precipitation, as well as maximum 1-hour, 2-hour and 6-hour precipitation over the past 24 hour period (to estimate where flash flooding may have occurred). The 24-hour, 48-hour and 72-hour total precipitation contain bias corrections that are not disaggregated into the hourly estimates, so there will likely be some differences. The accumulation ending time is 7AM of the date shown in the bottom right corner. Also shown optionally are vulnerable fire burn areas (post 2012), which are updated throughout the season to include new, vulnerable burn areas. The home button in the top left corner resets the map to the original zoom.

SPM 05-06-2020: Southeast Plains & Raton Ridge Receive Light Rainfall with Dry Conditions Elsewhere

Issue Date: Wednesday, May 6th, 2020
Issue Time: 8:50AM MDT

Summary:

High temperatures were on the rise Tuesday with the building ridge overhead. The max 24-hour temperature can be seen at the NWS ASOS locations below (MesoWest). Warmest temperatures were over the lower elevations of southern Colorado, and it was also quite warm in the Grand Valley.  Not much in the way of rainfall again yesterday. There were a couple rounds of weak showers over the Raton Ridge and adjacent Southeast Plains. Overall, totals were below 0.10 inches, so not much help to the increasing drought situation down there. More on that in Thursday’s FTO.

For precipitation estimates in your surrounding neighborhood yesterday, scroll down to the State Precipitation Map below.

Click Here For Map Overview

The map below shows radar-estimated, rainfall gage-adjusted Quantitative Precipitation Estimates (QPE) across Colorado. The map is updated daily during the operational season (May 1 – Sep 30) by 11AM. The following six layers are currently available: 24-hour, 48-hour and 72-hour total precipitation, as well as maximum 1-hour, 2-hour and 6-hour precipitation over the past 24 hour period (to estimate where flash flooding may have occurred). The 24-hour, 48-hour and 72-hour total precipitation contain bias corrections that are not disaggregated into the hourly estimates, so there will likely be some differences. The accumulation ending time is 7AM of the date shown in the bottom right corner. Also shown optionally are vulnerable fire burn areas (post 2012), which are updated throughout the season to include new, vulnerable burn areas. The home button in the top left corner resets the map to the original zoom.

SPM 05-05-2020: Light Rainfall for Eastern Colorado & Breezy Conditions

Issue Date: Tuesday, May 5th, 2020
Issue Time: 8:55AM MDT

Summary:

Monday started with some showers over the Northeast Plains and Northern Mountains with an exiting shortwave, but skies began to clear throughout the day. As far as rainfall, it was very limited with the rather dry atmosphere. A surface boundary helped produce some light showers and a couple storms over the Palmer Ridge during the late afternoon hours. As this boundary pushed south, it helped provide lift for more showers along the southern border overnight. Overall, the totals were estimated around 0.25 inches. Flooding was not reported.

The main story from yesterday was breezy conditions. Gusts reached to about 35 mph over the eastern plains and higher mountain elevations. Slightly lower wind speeds were present near the Wyman fire. The fire grew to 455 acres, so hopefully the break in winds today will help control the burn. Overnight temperatures dropped to 29F at Crow Creek (NE of Greeley), and frost was present along the Urban Corridor this morning. Over the mountains, temperatures dropped into the 20Fs with Alamosa near freezing.

For precipitation estimates in your area yesterday, scroll down to the State Precipitation Map below.

Click Here For Map Overview

The map below shows radar-estimated, rainfall gage-adjusted Quantitative Precipitation Estimates (QPE) across Colorado. The map is updated daily during the operational season (May 1 – Sep 30) by 11AM. The following six layers are currently available: 24-hour, 48-hour and 72-hour total precipitation, as well as maximum 1-hour, 2-hour and 6-hour precipitation over the past 24 hour period (to estimate where flash flooding may have occurred). The 24-hour, 48-hour and 72-hour total precipitation contain bias corrections that are not disaggregated into the hourly estimates, so there will likely be some differences. The accumulation ending time is 7AM of the date shown in the bottom right corner. Also shown optionally are vulnerable fire burn areas (post 2012), which are updated throughout the season to include new, vulnerable burn areas. The home button in the top left corner resets the map to the original zoom.