Issue Date: Thursday, May 7th, 2020
Issue Time: 9:05AM MDT
Summary:
Afternoon temperatures continued their upward trend yesterday despite another cold start Wednesday morning. There were no noteworthy rainfall accumulations across the state, and not a single CoCoRaHS station reported rainfall. It looks like there may have been some light showers over the Northern Mountains in Eagle County. Totals were under 0.05 inches. Fire danger returned to western Colorado and the San Luis Valley yesterday, and a Red Flag Warning was issued. A gust of 46 mph was recorded by the ASOS station in Craig, Colorado.
With all the fire danger the last few days and today, I thought it might be nice to review what constitutes a Red Flag Warning and some other fire weather terminology. Fire danger is usually categorized in a 3-tier system: Elevated, Critical, and Extreme. The difference between the categories has to do with sustained winds (speed and duration), relative humidity, dry fuels and temperatures. Dry fuels refers to ground vegetation’s ability to favor rapid fire growth. For example, brush in an area of drought would be considered high risk for fire growth. More fire terminology can be found HERE.
Red Flag Warnings are issued within 12-24 hours of red flag criteria being met for any 3-hours or more in a 12-hour span. Those criteria are:
1. Frequent gusts of 25 mph or greater AND relative humidity of 15% or less
2. Dry thunderstorms (15% coverage or more)
Other factors in addition to the basic criteria above (or a combination) may result in Red Flag Conditions:
3. Haines Index of 5 or 6, indicating a moderate or high potential for large, plume dominated fire growth
4. Wind shifts associated with frontal passages
5. First significant lightning event (wet or dry) after an extended hot and dry period
6. Poor relative humidity recovery overnight (RH remains at 40% or lower)
7. Any combination of weather and fuel moisture conditions which, in the judgment of the forecaster, would cause extensive wildfire occurrences
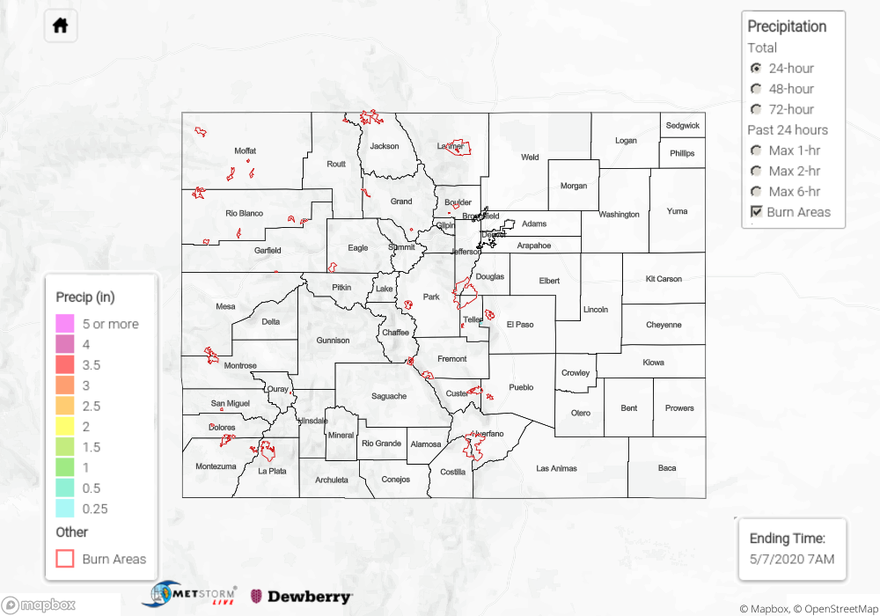
For precipitation estimates in over your area the last couple of days, scroll down to the State Precipitation Map below.
Click Here For Map Overview