SPM 06-05-2020: Severe Wind Gusts Cause Damage Over Northern Colorado

Issue Date: Friday, June 5th, 2020
Issue Time: 9:40AM MDT

Summary:

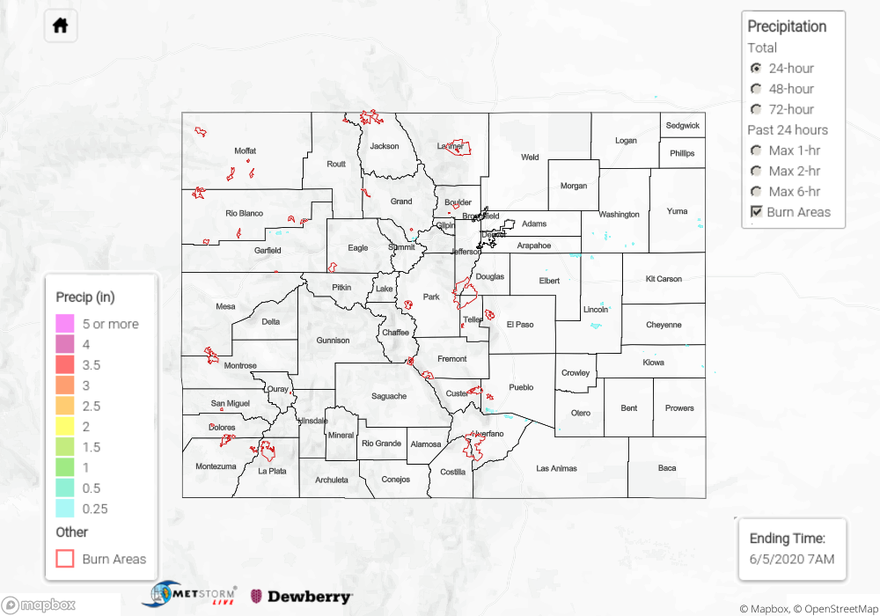
Boy did it get windy yesterday with the storms yesterday! This typically happens when thunderstorms become outflow driven due to low surface moisture. Soundings yesterday did have the inverted-V pattern, which means there is a large dew point depression (difference between dew point and temperature). As you can probably guess, these storms do not produce a lot of precipitation. The most impressive downburst yesterday was at the NCAR lab in Boulder, which recorded a 82 mph gust. As expected, there was damage. In Arvada, 3-inch tree limbs were broken, shingles were blown off homes and power lines were broken (power outages were also reported). After NCAR experienced the gust, NWS Boulder issued a Severe Thunderstorm Warning for the outflow boundary. Winds decreased a bit as they moved east – DIA recorded a 58 mph gust. Over Bennett, the guest was measured at 65 mph. That’s still very impressive! Storms were also present over the Northeast Plains, and again, impressive wind gusts with rain totals only around 0.25 inches. Zero visibility was reported in Yuma County north of Yuma where gusts in the area were in the 60 to 70 mph range. Back west, winds were also whipping around under storms that formed. Gusts between 50 and 60 mph were recorded near Fruita, Rifle, Kremmling and Craig at ASOS stations. Rainfall estimations were under 0.10 inches in the area.

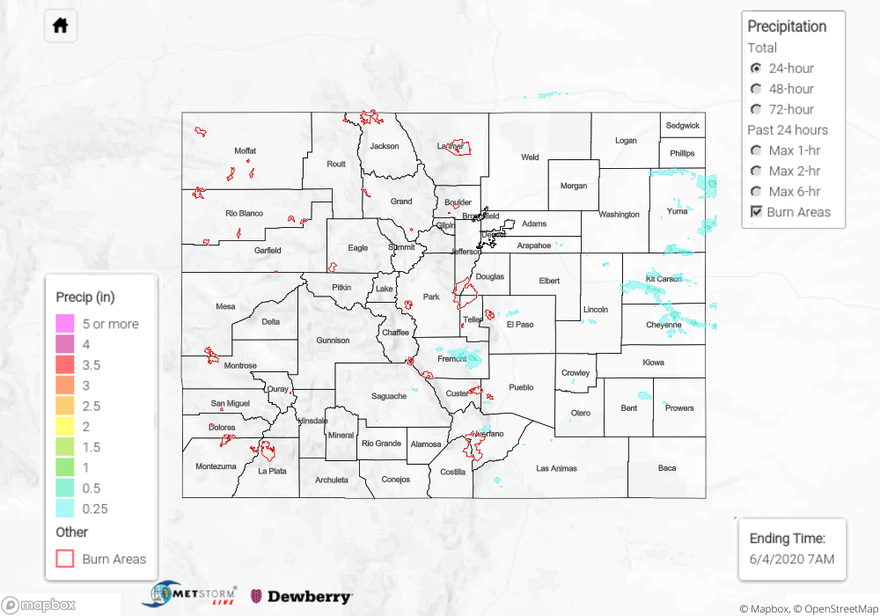
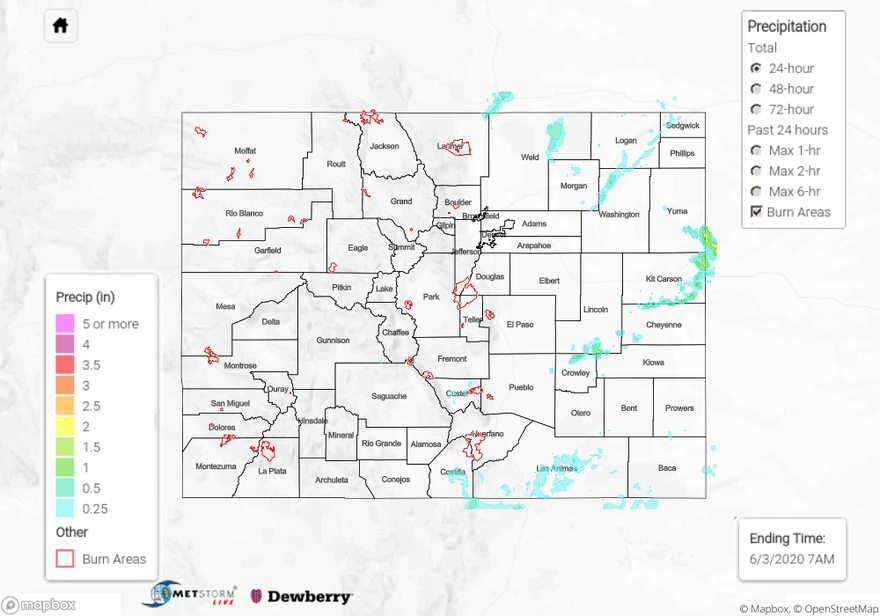
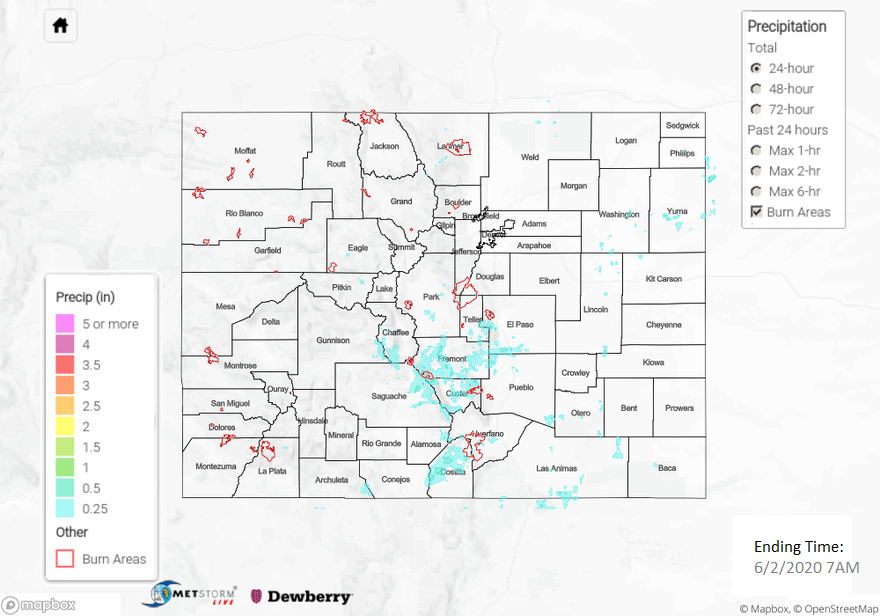
For precipitation estimates in your area over the last 24 to 72-hours, scroll down to the State Precipitation Map below.

Click Here For Map Overview

The map below shows radar-estimated, rainfall gage-adjusted Quantitative Precipitation Estimates (QPE) across Colorado. The map is updated daily during the operational season (May 1 – Sep 30) by 11AM. The following six layers are currently available: 24-hour, 48-hour and 72-hour total precipitation, as well as maximum 1-hour, 2-hour and 6-hour precipitation over the past 24 hour period (to estimate where flash flooding may have occurred). The 24-hour, 48-hour and 72-hour total precipitation contain bias corrections that are not disaggregated into the hourly estimates, so there will likely be some differences. The accumulation ending time is 7AM of the date shown in the bottom right corner. Also shown optionally are vulnerable fire burn areas (post 2012), which are updated throughout the season to include new, vulnerable burn areas. The home button in the top left corner resets the map to the original zoom.

SPM 06-04-2020: Severe Thunderstorms for the Eastern Plains

Issue Date: Thursday, June 4th, 2020
Issue Time: 9:40AM MDT

Summary:

For the most part, storms were high-based yesterday and produced little rainfall. A stronger storm over Fremont County produced a wind gust of 62 mph, which means it was likely outflow driven with only brief rainfall. Radar and nearby CoCoRaHS showed 0.50 inches of rainfall. Further east along a dryline, storms were able to produce more rainfall and some hail. Hail up to 1.75 inches in diameter was reported in Yuma County, and storms in the area produced (up to) 50 mph outflow boundary gusts. It’s a rural and very ungauged area, but radar estimated up to 0.75 inches of rain in the cores of the severe thunderstorms. Flooding was not reported on Wednesday.

For precipitation estimates in your area over the last 72-hours, scroll down to the State Precipitation Map below.

Click Here For Map Overview

The map below shows radar-estimated, rainfall gage-adjusted Quantitative Precipitation Estimates (QPE) across Colorado. The map is updated daily during the operational season (May 1 – Sep 30) by 11AM. The following six layers are currently available: 24-hour, 48-hour and 72-hour total precipitation, as well as maximum 1-hour, 2-hour and 6-hour precipitation over the past 24 hour period (to estimate where flash flooding may have occurred). The 24-hour, 48-hour and 72-hour total precipitation contain bias corrections that are not disaggregated into the hourly estimates, so there will likely be some differences. The accumulation ending time is 7AM of the date shown in the bottom right corner. Also shown optionally are vulnerable fire burn areas (post 2012), which are updated throughout the season to include new, vulnerable burn areas. The home button in the top left corner resets the map to the original zoom.

SPM 06-03-2020: Severe Thunderstorms and Flooding for Northeast Border Counties

Issue Date: Wednesday, June 3rd, 2020
Issue Time: 10:15AM MDT

Summary:

The drying trend began yesterday with the high located to our south and westerly/northwesterly flow aloft. This caused a downtick in afternoon storms activity over the mountains with little to no activity west of the Continental Divide. Totals over the eastern mountains were typically under 0.10 inches with the southern Southeast Mountains receiving around 0.25 inches. As storms moved east, moisture increased a little, so totals increased to about 0.50-0.75 inches. A Severe Thunderstorm Warning was issued for Weld County during the evening.

Higher moisture was located over the eastern plains where a convergence boundary was located (weak “cold” front). Nearly stationary storms in the late afternoon/evening produced some very high totals, landspouts, and flash flooding over Kit Carson and Cheyenne Counties. A strong outflow gust south of Burlington caused a mini dust storm with zero visibility. Over 2 inches of rain fell in 30 minutes between Goodland and Burlington along the border! Not surprising that a Flash Flood Warning was issued for these storms.

For precipitation estimates in your area over the last 24- to 72-hours, scroll down to the State Precipitation Map below.

Click Here For Map Overview

The map below shows radar-estimated, rainfall gage-adjusted Quantitative Precipitation Estimates (QPE) across Colorado. The map is updated daily during the operational season (May 1 – Sep 30) by 11AM. The following six layers are currently available: 24-hour, 48-hour and 72-hour total precipitation, as well as maximum 1-hour, 2-hour and 6-hour precipitation over the past 24 hour period (to estimate where flash flooding may have occurred). The 24-hour, 48-hour and 72-hour total precipitation contain bias corrections that are not disaggregated into the hourly estimates, so there will likely be some differences. The accumulation ending time is 7AM of the date shown in the bottom right corner. Also shown optionally are vulnerable fire burn areas (post 2012), which are updated throughout the season to include new, vulnerable burn areas. The home button in the top left corner resets the map to the original zoom.

SPM 06-02-2020: Early Summer Heat Continues, Along With Scattered Storms

Issue Date: Tuesday, June 2, 2020
Issue Time: 10:40AM MDT

Summary:

Very hot temperatures continued across Colorado on Monday, fittingly the first day of meteorological summer. Noteworthy high temperatures included:

99F at La Junta (4,200 ft)
97F at Fort Morgan (4,500 ft)
92F at Denver International Airport (5,400 ft)
81F at Steamboat Springs (6,900 ft)
86F at Alamosa (7,600 ft)
72F at Leadville (9,900 ft)

Along with the heat came above average moisture, by early June standards, leading to scattered afternoon showers and thunderstorms mainly across southern areas. The highest observed rainfall came in at 1.05 inches from near Fort Garland in the San Luis Valley. This is extremely unusual for this time of year, as that area typically does not see heavier rainfall until the monsoon season. More common were amounts in the 0.25-0.50 inch range. These amounts are usually not enough to warrant flooding, unless of course they fall over fire burns. Indeed, there were two such NWS products issued. First, a Flash Flood Warning was issued for the Hayden Pass burn scar around 2:40PM. Second, a Small Stream Flood Advisory was issued for the High Park burn scar in Larimer County around 4:55PM. Fortunately, neither location reported any flooding, but we are reminded how sensitive these areas can be due to a lack of vegetation and a hygroscopic top layer that can efficiently repel water.

For precipitation estimates in your neighborhood over the last 72-hours, scroll down to the State Precipitation Map below.

Click Here For Map Overview

The map below shows radar-estimated, rainfall gage-adjusted Quantitative Precipitation Estimates (QPE) across Colorado. The map is updated daily during the operational season (May 1 – Sep 30) by 11AM. The following six layers are currently available: 24-hour, 48-hour and 72-hour total precipitation, as well as maximum 1-hour, 2-hour and 6-hour precipitation over the past 24 hour period (to estimate where flash flooding may have occurred). The 24-hour, 48-hour and 72-hour total precipitation contain bias corrections that are not disaggregated into the hourly estimates, so there will likely be some differences. The accumulation ending time is 7AM of the date shown in the bottom right corner. Also shown optionally are vulnerable fire burn areas (post 2012), which are updated throughout the season to include new, vulnerable burn areas. The home button in the top left corner resets the map to the original zoom.