Issue Date: Friday, June 5th, 2020
Issue Time: 9:40AM MDT
Summary:
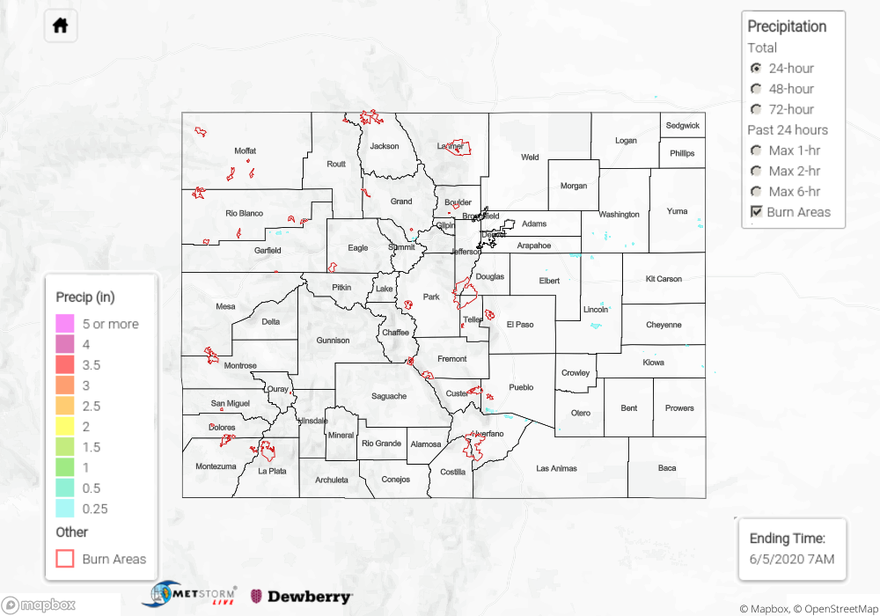
Boy did it get windy yesterday with the storms yesterday! This typically happens when thunderstorms become outflow driven due to low surface moisture. Soundings yesterday did have the inverted-V pattern, which means there is a large dew point depression (difference between dew point and temperature). As you can probably guess, these storms do not produce a lot of precipitation. The most impressive downburst yesterday was at the NCAR lab in Boulder, which recorded a 82 mph gust. As expected, there was damage. In Arvada, 3-inch tree limbs were broken, shingles were blown off homes and power lines were broken (power outages were also reported). After NCAR experienced the gust, NWS Boulder issued a Severe Thunderstorm Warning for the outflow boundary. Winds decreased a bit as they moved east – DIA recorded a 58 mph gust. Over Bennett, the guest was measured at 65 mph. That’s still very impressive! Storms were also present over the Northeast Plains, and again, impressive wind gusts with rain totals only around 0.25 inches. Zero visibility was reported in Yuma County north of Yuma where gusts in the area were in the 60 to 70 mph range. Back west, winds were also whipping around under storms that formed. Gusts between 50 and 60 mph were recorded near Fruita, Rifle, Kremmling and Craig at ASOS stations. Rainfall estimations were under 0.10 inches in the area.
For precipitation estimates in your area over the last 24 to 72-hours, scroll down to the State Precipitation Map below.
