SPM 06-09-2020: Rare June Event Brings Every Flavor of Weather

Issue Date: Tuesday, June 9th, 2020
Issue Time: 9:50AM MDT

Summary:

Wild weather day across Colorado yesterday, which is very fitting for the times. There were Red Flag Warnings, High Wind Warnings, freezing overnight temperatures, rainfall, hail, and snow. Take a look for yourself here: click me

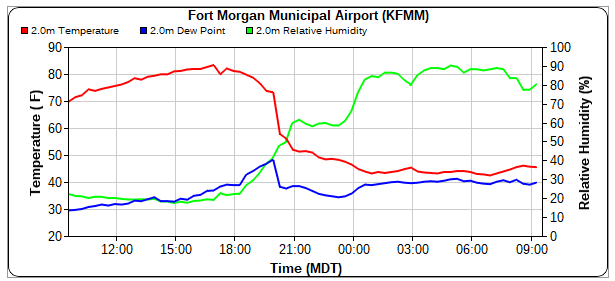
The snowline even fell low enough there were accumulations on grassy surfaces over the Palmer Ridge (Monument Hill)! This was all due to a strengthening Low pressure system overhead, which sent a wicked, late season cold front howling south across eastern CO yesterday evening. Wind gusts with the front were up to 75 mph (Limon). You can see the quick temperature drop at the Fort Morgan Airport as well as a slight increase in moisture after the front passed below (source: MesoWest).

An overnight microburst also caused a lot of damage reports over the Northeast Plains between 12AM and 1AM. Numerous power lines were downed (50+), several outbuildings destroyed (including at 60 ft by 200 ft hog barn), carports removed from houses, silos demolished and a radio repeater tower folded in half. A station in Akron recorded a 102 mph gust during this period and another station near Akron recorded a 83 mph gust. NWS Boulder will likely be assessing damage this afternoon or tomorrow, so be sure to follow them for the results.

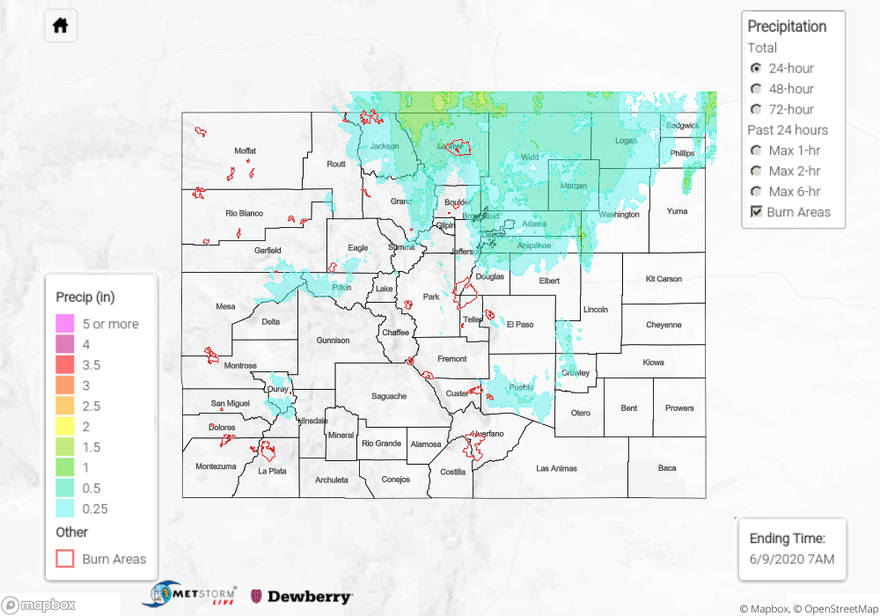
As far as snowfall totals coming in this morning, Ophir/Telluride in San Miguel County reported 5-6 inches. Around Woodland, CO totals up to 4.5 inches were reported. I’m very interested to see what sort of totals show up over the northern Front Range and Northern Mountains as snowfall start earlier here and QPE is estimated around 1 inch. Trail Ridge Road was temporarily closed as of this morning.

Further east, the precipitation fell as rain. The highest totals were over northern Yuma County where an MCS dipped south for some heavy overnight rainfall. Radar estimates up to 1.5 inches of rain fell in the area. This area isn’t very well gauged, but the Holyoke COAgMET gauge measured 0.5 inches.

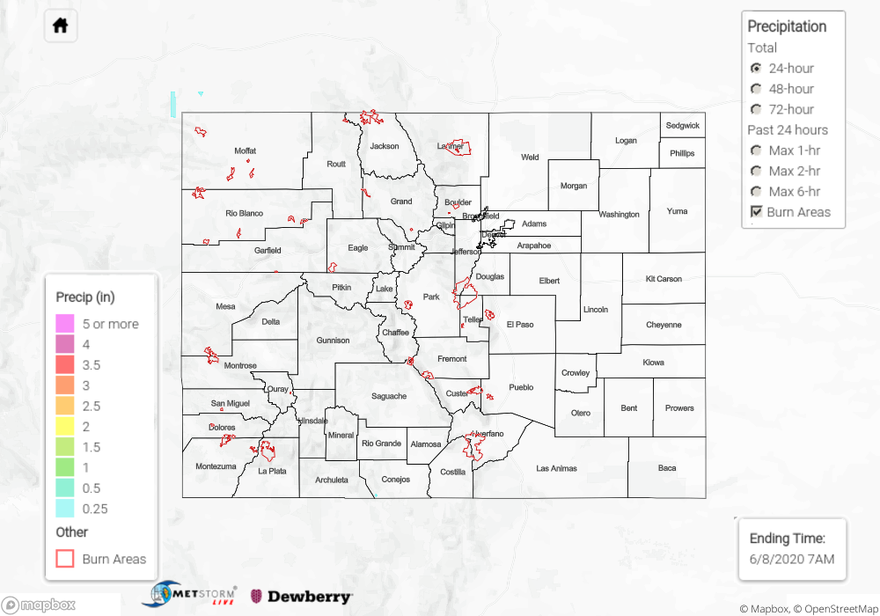
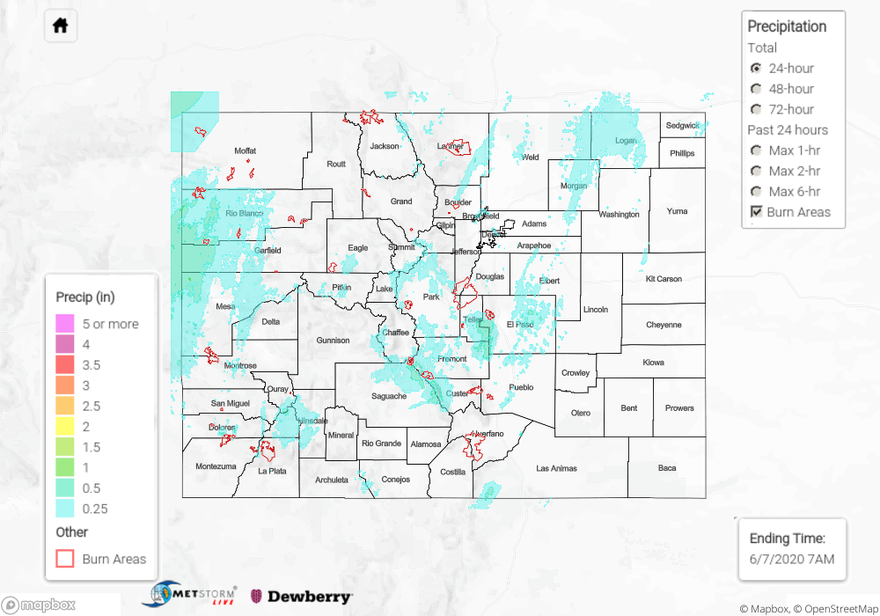
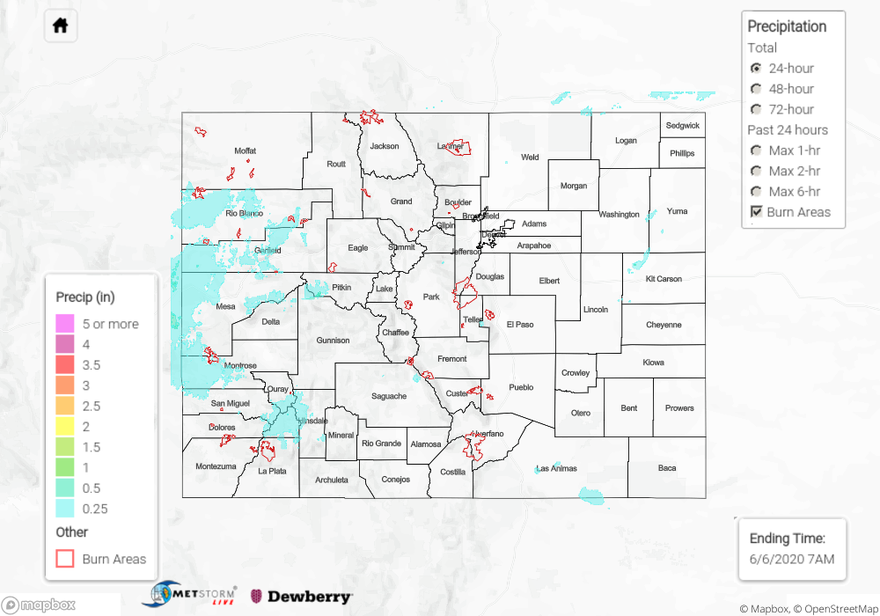
For precipitation estimates in your neighborhood over the last 24-hours, scroll down to the State Precipitation Map below.

Click Here For Map Overview

The map below shows radar-estimated, rainfall gage-adjusted Quantitative Precipitation Estimates (QPE) across Colorado. The map is updated daily during the operational season (May 1 – Sep 30) by 11AM. The following six layers are currently available: 24-hour, 48-hour and 72-hour total precipitation, as well as maximum 1-hour, 2-hour and 6-hour precipitation over the past 24 hour period (to estimate where flash flooding may have occurred). The 24-hour, 48-hour and 72-hour total precipitation contain bias corrections that are not disaggregated into the hourly estimates, so there will likely be some differences. The accumulation ending time is 7AM of the date shown in the bottom right corner. Also shown optionally are vulnerable fire burn areas (post 2012), which are updated throughout the season to include new, vulnerable burn areas. The home button in the top left corner resets the map to the original zoom.

SPM 06-08-2020: High Winds Return Without Much Rainfall

Issue Date: Monday, June 8th, 2020
Issue Time: 10:35AM MDT

Summary:

High winds continued on Sunday, although nothing like the historical derecho event on Saturday. For the most part, it was quiet behind the trough on the rainfall front as moisture mixed out. There were some morning and afternoon showers over the Northwest Slope as it remained in an area where mid-level was still occurring with a little moisture. These storms were high-based and generated only about 0.05-0.10 inches of rainfall. High wind gusts were recorded across western Colorado in the 45-55 mph range with the strong jet overhead. Even stronger winds were produced over the eastern border during the afternoon and evening hours where ASOS stations recorded between 45 and 65 mph gusts. This caused visibility to drop to nearly zero in eastern Yuma County. This was again due to the trough overhead and lee surface trough helping to tighten the surface gradient.
For precipitation estimates in your area over the last 24 to 72-hours, scroll down to the State Precipitation Map below.

Click Here For Map Overview

The map below shows radar-estimated, rainfall gage-adjusted Quantitative Precipitation Estimates (QPE) across Colorado. The map is updated daily during the operational season (May 1 – Sep 30) by 11AM. The following six layers are currently available: 24-hour, 48-hour and 72-hour total precipitation, as well as maximum 1-hour, 2-hour and 6-hour precipitation over the past 24 hour period (to estimate where flash flooding may have occurred). The 24-hour, 48-hour and 72-hour total precipitation contain bias corrections that are not disaggregated into the hourly estimates, so there will likely be some differences. The accumulation ending time is 7AM of the date shown in the bottom right corner. Also shown optionally are vulnerable fire burn areas (post 2012), which are updated throughout the season to include new, vulnerable burn areas. The home button in the top left corner resets the map to the original zoom.

SPM 06-07-2020: Severe Winds Blew Across Colorado

Issue Date: Sunday, June 7th, 2020
Issue Time: 9:00 AM MDT

Summary:

Yesterday featured a fairly rare severe weather event for Colorado as a fast-moving low-pressure disturbance raced across the state. Severe weather is typical for this time of year for the eastern plains and occurs somewhat frequently over the High Country and Western Slope, but the density and magnitude of severe weather reports was something not typically seen. Severe thunderstorm winds were reported all across the state, with the following being the most severe:

110 mph: 6 miles SW of Winter Park (Grand County)
99 mph: 2 miles SW of Great Divide (Moffat County)
90 mph: 2 miles E of Copper Mountain (Summit County)
86 mph: 13 miles ENE of Buford (Rio Blanco County)
85 mph: Cedar Point (Elbert County)
82 mph: 7 miles N of Rockport (Weld County)
80 mph: 1 mile NNE of Castle Pines (Douglas County)

In addition to the thunderstorm winds, quick bouts with moderate-to-heavy rainfall attended the stronger thunderstorms, but not enough to cause any flash flooding on Saturday. Multiple flood advisories were issued by the Grand Junction National Weather Service office for urban and small stream flooding, but no reports were available for verification. For rainfall estimates in your area, check out our State Precipitation Map below.

Click Here For Map Overview

The map below shows radar-estimated, rainfall gage-adjusted Quantitative Precipitation Estimates (QPE) across Colorado. The map is updated daily during the operational season (May 1 – Sep 30) by 11AM. The following six layers are currently available: 24-hour, 48-hour and 72-hour total precipitation, as well as maximum 1-hour, 2-hour and 6-hour precipitation over the past 24 hour period (to estimate where flash flooding may have occurred). The 24-hour, 48-hour and 72-hour total precipitation contain bias corrections that are not disaggregated into the hourly estimates, so there will likely be some differences. The accumulation ending time is 7AM of the date shown in the bottom right corner. Also shown optionally are vulnerable fire burn areas (post 2012), which are updated throughout the season to include new, vulnerable burn areas. The home button in the top left corner resets the map to the original zoom.

SPM 06-06-2020: Surge of Moisture Reaches Western Colorado

Issue Date: Saturday, June 6th, 2020
Issue Time: 9:00 AM MDT

Summary:

As the long-anticipated Low pressure system started to finally make its way inland on the West Coast yesterday, westerly flow aloft became more southwesterly and a surge of Pacific moisture slid into Colorado. This moisture provided the fuel for widespread showers and thunderstorms across the Western Slope and High Country, with more widely scattered coverage over eastern Colorado. A few storms over western Colorado produced severe wind gusts and associated damage, including downed power lines, uprooted trees, and a large section of fence blown over in Mesa County. Some of the highest wind gust reports include:

77 mph: 4 miles NE of Cameo (Mesa County)
70 mph: Meeker (Rio Blanco County)
68 mph: Douglas Pass (Garfield County)
67 mph: 12 miles NW of Greystone (Moffat County)

As far as rainfall was concerned, rates were generally light-to-moderate owing to the fact that dry air near the surface mitigated the moisture surge’s impacts. Some of the higher rainfall totals according to CoCoRaHS observations (as of 8 AM MDT) are as follows:

0.54 inches: San Juan County
0.44 inches: Mesa County
0.43 inches: Delta County
0.42 inches: La Plata County
0.36 inches: Archuleta County
0.35 inches: Moffat County

Flooding was not reported on Saturday. For rainfall estimates in your area, check out our State Precipitation Map below.

Click Here For Map Overview

The map below shows radar-estimated, rainfall gage-adjusted Quantitative Precipitation Estimates (QPE) across Colorado. The map is updated daily during the operational season (May 1 – Sep 30) by 11AM. The following six layers are currently available: 24-hour, 48-hour and 72-hour total precipitation, as well as maximum 1-hour, 2-hour and 6-hour precipitation over the past 24 hour period (to estimate where flash flooding may have occurred). The 24-hour, 48-hour and 72-hour total precipitation contain bias corrections that are not disaggregated into the hourly estimates, so there will likely be some differences. The accumulation ending time is 7AM of the date shown in the bottom right corner. Also shown optionally are vulnerable fire burn areas (post 2012), which are updated throughout the season to include new, vulnerable burn areas. The home button in the top left corner resets the map to the original zoom.