Issue Date: Tuesday, June 9th, 2020
Issue Time: 9:50AM MDT
Summary:
Wild weather day across Colorado yesterday, which is very fitting for the times. There were Red Flag Warnings, High Wind Warnings, freezing overnight temperatures, rainfall, hail, and snow. Take a look for yourself here: click me
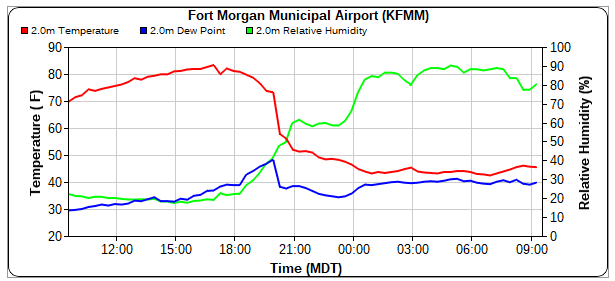
The snowline even fell low enough there were accumulations on grassy surfaces over the Palmer Ridge (Monument Hill)! This was all due to a strengthening Low pressure system overhead, which sent a wicked, late season cold front howling south across eastern CO yesterday evening. Wind gusts with the front were up to 75 mph (Limon). You can see the quick temperature drop at the Fort Morgan Airport as well as a slight increase in moisture after the front passed below (source: MesoWest).

An overnight microburst also caused a lot of damage reports over the Northeast Plains between 12AM and 1AM. Numerous power lines were downed (50+), several outbuildings destroyed (including at 60 ft by 200 ft hog barn), carports removed from houses, silos demolished and a radio repeater tower folded in half. A station in Akron recorded a 102 mph gust during this period and another station near Akron recorded a 83 mph gust. NWS Boulder will likely be assessing damage this afternoon or tomorrow, so be sure to follow them for the results.
As far as snowfall totals coming in this morning, Ophir/Telluride in San Miguel County reported 5-6 inches. Around Woodland, CO totals up to 4.5 inches were reported. I’m very interested to see what sort of totals show up over the northern Front Range and Northern Mountains as snowfall start earlier here and QPE is estimated around 1 inch. Trail Ridge Road was temporarily closed as of this morning.
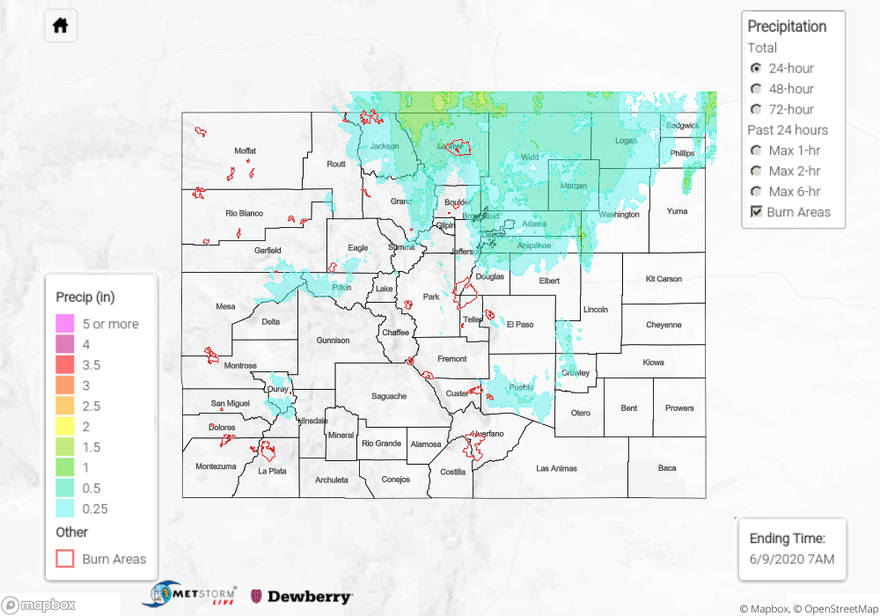
Further east, the precipitation fell as rain. The highest totals were over northern Yuma County where an MCS dipped south for some heavy overnight rainfall. Radar estimates up to 1.5 inches of rain fell in the area. This area isn’t very well gauged, but the Holyoke COAgMET gauge measured 0.5 inches.
For precipitation estimates in your neighborhood over the last 24-hours, scroll down to the State Precipitation Map below.
Click Here For Map Overview
