Issue Date: Sunday, June 7th, 2020
Issue Time: 9:00 AM MDT
Summary:
Yesterday featured a fairly rare severe weather event for Colorado as a fast-moving low-pressure disturbance raced across the state. Severe weather is typical for this time of year for the eastern plains and occurs somewhat frequently over the High Country and Western Slope, but the density and magnitude of severe weather reports was something not typically seen. Severe thunderstorm winds were reported all across the state, with the following being the most severe:
110 mph: 6 miles SW of Winter Park (Grand County)
99 mph: 2 miles SW of Great Divide (Moffat County)
90 mph: 2 miles E of Copper Mountain (Summit County)
86 mph: 13 miles ENE of Buford (Rio Blanco County)
85 mph: Cedar Point (Elbert County)
82 mph: 7 miles N of Rockport (Weld County)
80 mph: 1 mile NNE of Castle Pines (Douglas County)
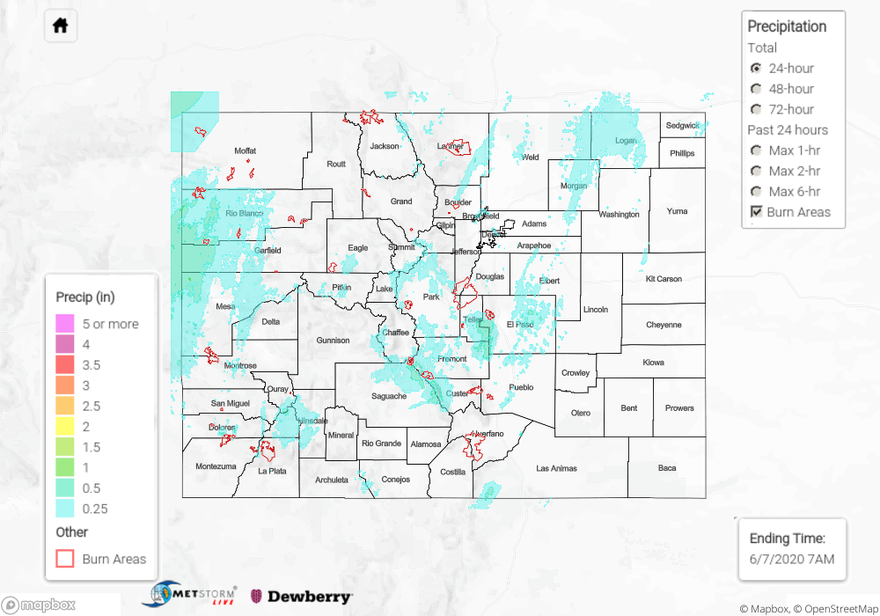
In addition to the thunderstorm winds, quick bouts with moderate-to-heavy rainfall attended the stronger thunderstorms, but not enough to cause any flash flooding on Saturday. Multiple flood advisories were issued by the Grand Junction National Weather Service office for urban and small stream flooding, but no reports were available for verification. For rainfall estimates in your area, check out our State Precipitation Map below.
Click Here For Map Overview