Issue Date: Saturday, June 6th, 2020
Issue Time: 9:00 AM MDT
Summary:
As the long-anticipated Low pressure system started to finally make its way inland on the West Coast yesterday, westerly flow aloft became more southwesterly and a surge of Pacific moisture slid into Colorado. This moisture provided the fuel for widespread showers and thunderstorms across the Western Slope and High Country, with more widely scattered coverage over eastern Colorado. A few storms over western Colorado produced severe wind gusts and associated damage, including downed power lines, uprooted trees, and a large section of fence blown over in Mesa County. Some of the highest wind gust reports include:
77 mph: 4 miles NE of Cameo (Mesa County)
70 mph: Meeker (Rio Blanco County)
68 mph: Douglas Pass (Garfield County)
67 mph: 12 miles NW of Greystone (Moffat County)
As far as rainfall was concerned, rates were generally light-to-moderate owing to the fact that dry air near the surface mitigated the moisture surge’s impacts. Some of the higher rainfall totals according to CoCoRaHS observations (as of 8 AM MDT) are as follows:
0.54 inches: San Juan County
0.44 inches: Mesa County
0.43 inches: Delta County
0.42 inches: La Plata County
0.36 inches: Archuleta County
0.35 inches: Moffat County
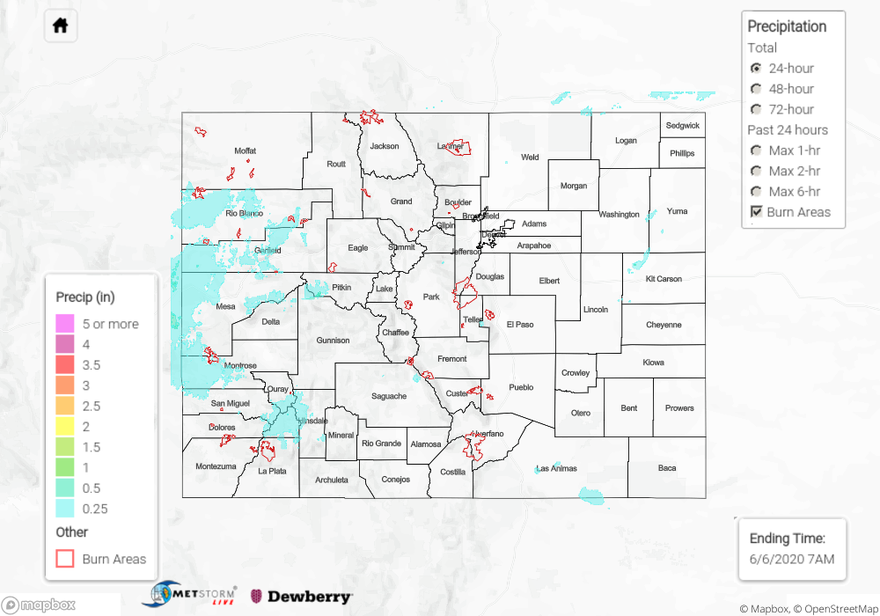
Flooding was not reported on Saturday. For rainfall estimates in your area, check out our State Precipitation Map below.
Click Here For Map Overview