SPM 06-13-2020: Isolated Afternoon and Evening Storms Returned to Southern Colorado

Issue Date: Saturday, June 13th, 2020
Issue Time: 10:05AM MDT

Summary:

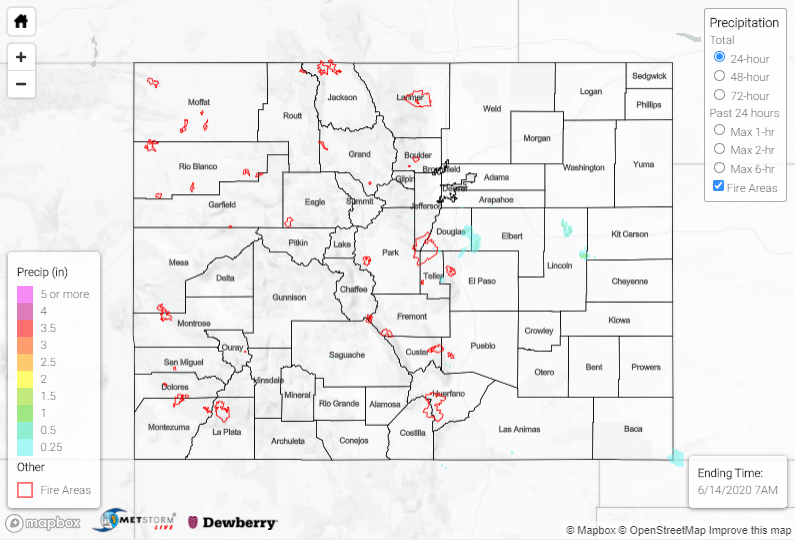
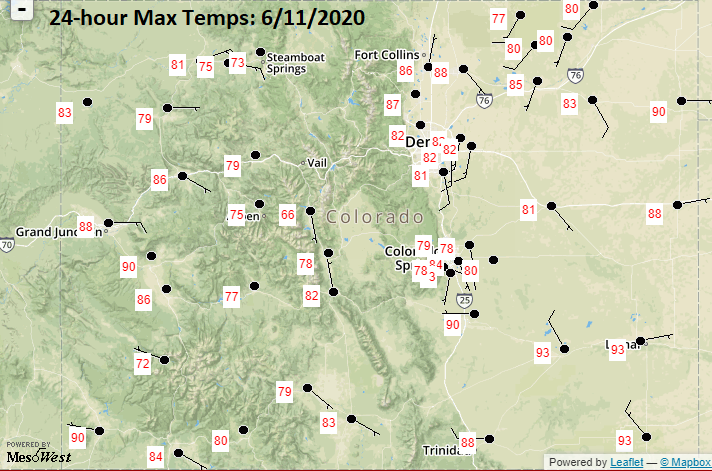
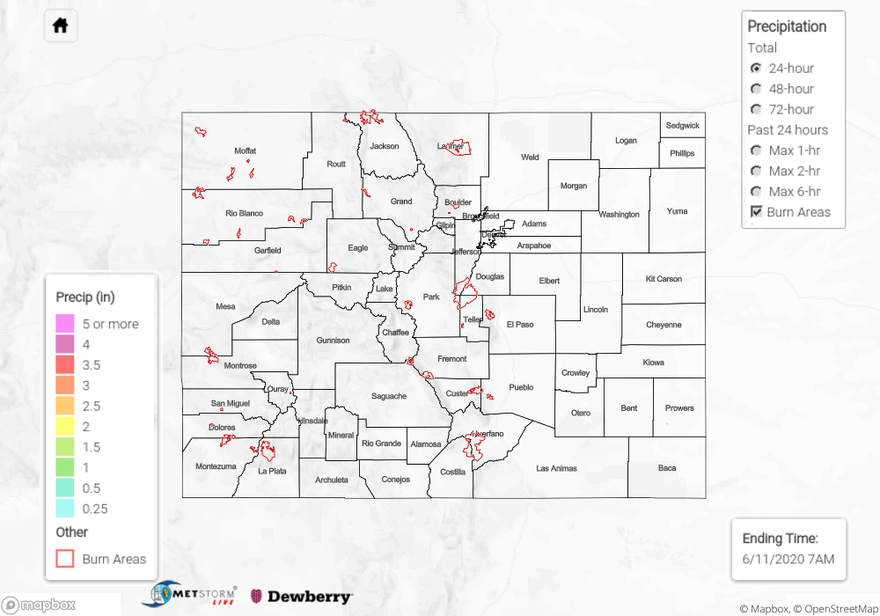
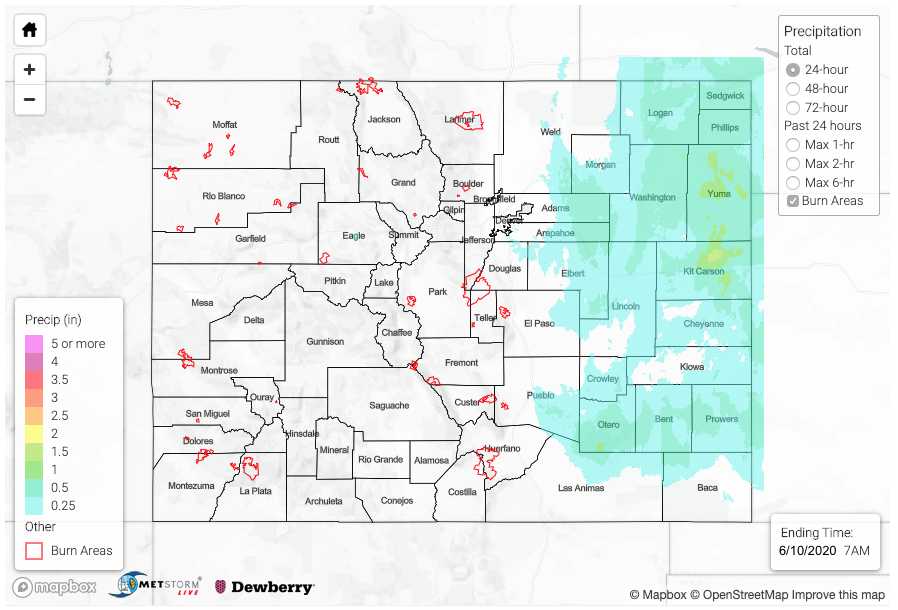
Temperatures went a few degrees up yesterday with max highs reaching the upper 90Fs over the Southeast Plains and Grand Valley. Grand Junction was just 1F shy of its daily 100F record! As far as rainfall, a little subtropical moisture made its way across the southern border. A few storms popped over the southern high terrains and Raton/Palmer Ridge by early afternoon. The dry boundary layer to the west kept measurable rainfall limited. Radar estimations indicate that the highest peaks of the San Juans reached up to 0.15 inches of rainfall. Over the Raton Ridge area, isolated rain totals up to 0.50 inches were estimated with most storms only producing 0.25 inches. The strongest storm of the day was over the Palmer Ridge (Douglas County) around 7PM. Around 0.75 inches of rain was estimated in its core with a CoCoRaHS station recording 0.46 inches of precipitation in Franktown. That’s very impressive as the evening sounding at Denver Airport showed PW values just over a half of an inch. It is likely that some mid-level energy was moving through the flow during this time frame, which helped enhance the storm’s lift. Activity ended a couple hours after the sun set with no lifting mechanism to keep them lingering overnight.

For precipitation estimates in your area over the last 24 to 72-hours, scroll down to the State Precipitation Map below. Note that the high QPE values over eastern and northern Lincoln County are over estimations.

Click Here For Map Overview

The map below shows radar-estimated, rainfall gage-adjusted Quantitative Precipitation Estimates (QPE) across Colorado. The map is updated daily during the operational season (May 1 – Sep 30) by 11AM. The following six layers are currently available: 24-hour, 48-hour and 72-hour total precipitation, as well as maximum 1-hour, 2-hour and 6-hour precipitation over the past 24 hour period (to estimate where flash flooding may have occurred). The accumulation ending time is 7AM of the date shown in the bottom right corner. Also shown optionally are vulnerable fire burn areas (post 2012), which are updated throughout the season to include new, vulnerable burn areas. The home button in the top left corner resets the map to the original zoom.


Note: The 24-hour, 48-hour and 72-hour total precipitation do not contain bias corrections today due to errors in the CoCoRaHS data. This means there may be underestimations in QPE over the southwest and southeast corners of the state.

SPM 06-12-2020: Dry and Warm Summer Day

Issue Date: Friday, June 12th, 2020
Issue Time: 9:45AM MDT

Summary:

It was another quiet weather day yesterday with the ridge building overhead, little to no moisture, and subsidence (sinking motion) over the state. Other than some afternoon cloud cover, it was the perfect summer day. Very hot temperatures were just to our west where several gages came within a couple degrees of the daily record highs. Rainfall was not recorded at any gages, but radar indicated some light precipitation may have fallen over eastern El Paso County.

Below are the high temperatures from Thursday afternoon (source: MesoWest). That’s quite the rebound from Tuesday, which is shown below yesterday’s highs. DIA went from 68F to 82F, and other areas across the state also saw this 15-20F temperature swing. The most impressive area to look at is the eastern plains. This area received rainfall most of the day, so temperatures were not able to warm much.

For precipitation estimates in your area over the last 72-hours, scroll down to the State Precipitation Map below.

Click Here For Map Overview

The map below shows radar-estimated, rainfall gage-adjusted Quantitative Precipitation Estimates (QPE) across Colorado. The map is updated daily during the operational season (May 1 – Sep 30) by 11AM. The following six layers are currently available: 24-hour, 48-hour and 72-hour total precipitation, as well as maximum 1-hour, 2-hour and 6-hour precipitation over the past 24 hour period (to estimate where flash flooding may have occurred). The 24-hour, 48-hour and 72-hour total precipitation contain bias corrections that are not disaggregated into the hourly estimates, so there will likely be some differences. The accumulation ending time is 7AM of the date shown in the bottom right corner. Also shown optionally are vulnerable fire burn areas (post 2012), which are updated throughout the season to include new, vulnerable burn areas. The home button in the top left corner resets the map to the original zoom.

SPM 06-11-2020: A Perfect Summer Day

Issue Date: Tuesday, June 11, 2020
Issue Time: 9:40AM

Summary:

After a prolonged period of rather tumultuous weather across Colorado, Wednesday provided a bit of respite. Temperatures about 10F below normal were accompanied by partly cloudy skies with a gentle breeze. As shown below from the NOHRSC snow analysis, up to 1 inch of liquid melted off (or evaporated/sublimated away) on Wednesday over northern areas! This was mostly snow that accumulated during the recent precipitation event. Fortunately, there were no reports of flooding as rivers and creeks were running significantly below flood stage.

For precipitation estimates in your neighborhood over the last 72-hours, scroll down to the State Precipitation Map below.

Click Here For Map Overview

The map below shows radar-estimated, rainfall gage-adjusted Quantitative Precipitation Estimates (QPE) across Colorado. The map is updated daily during the operational season (May 1 – Sep 30) by 11AM. The following six layers are currently available: 24-hour, 48-hour and 72-hour total precipitation, as well as maximum 1-hour, 2-hour and 6-hour precipitation over the past 24 hour period (to estimate where flash flooding may have occurred). The 24-hour, 48-hour and 72-hour total precipitation contain bias corrections that are not disaggregated into the hourly estimates, so there will likely be some differences. The accumulation ending time is 7AM of the date shown in the bottom right corner. Also shown optionally are vulnerable fire burn areas (post 2012), which are updated throughout the season to include new, vulnerable burn areas. The home button in the top left corner resets the map to the original zoom.

SPM 06-10-2020: Rainfall and High Winds for Eastern Colorado

Issue Date: Wednesday, June 10th, 2020
Issue Time: 10AM MDT

Summary:

The strong low pressure system moved into the eastern plains yesterday morning bringing rainfall from late morning into the early evening. Without much instability being able to build, storms produced beneficial rainfall rather than server weather. Upper dynamical support and higher moisture allowed for some decent totals. Kit Carson and Yuma Counties were the winners over the Northeast Plains with totals between 1 and 1.5 inches. A CoCoRaHS station north of Burlington recorded 1.5 inches with others in the area recording 1.22 and 1.37 inches. Generally, totals were estimated between 0.5 and 0.75 inches.

Over the Southeast Plains, rainfall wasn’t quite as widespread, although there were pockets up to 0.75 inches of rain in Otero and Prowers Counties. A USGS gauge near Houghton recorded 0.56 inches. This may have helped alleviate some of the drought over the area, although over the last 30 days precipitation over most of the Southeast Plains was between 1 and 2 inches below normal. Gusts reached 83 mph in Cheyenne County just after 11AM with sustained winds in the 40-50 mph range over the same area. No doubt this probably caused some power outage issues in the area.

Some fun satellite images below show the before and after the snow storm. I had to wait until this morning to grab the comparison as it was pretty cloudy yesterday. The images from College of DuPage are definitely showing an enhancement of the snow pack. I really like the difference over Pikes Peak and Blanca Peak.

For precipitation estimates in your area over the last 24 to 48-hours, scroll down to the State Precipitation Map below.

Click Here For Map Overview

The map below shows radar-estimated, rainfall gage-adjusted Quantitative Precipitation Estimates (QPE) across Colorado. The map is updated daily during the operational season (May 1 – Sep 30) by 11AM. The following six layers are currently available: 24-hour, 48-hour and 72-hour total precipitation, as well as maximum 1-hour, 2-hour and 6-hour precipitation over the past 24 hour period (to estimate where flash flooding may have occurred). The 24-hour, 48-hour and 72-hour total precipitation contain bias corrections that are not disaggregated into the hourly estimates, so there will likely be some differences. The accumulation ending time is 7AM of the date shown in the bottom right corner. Also shown optionally are vulnerable fire burn areas (post 2012), which are updated throughout the season to include new, vulnerable burn areas. The home button in the top left corner resets the map to the original zoom.