Issue Date: Tuesday, June 11, 2020
Issue Time: 9:40AM
Summary:
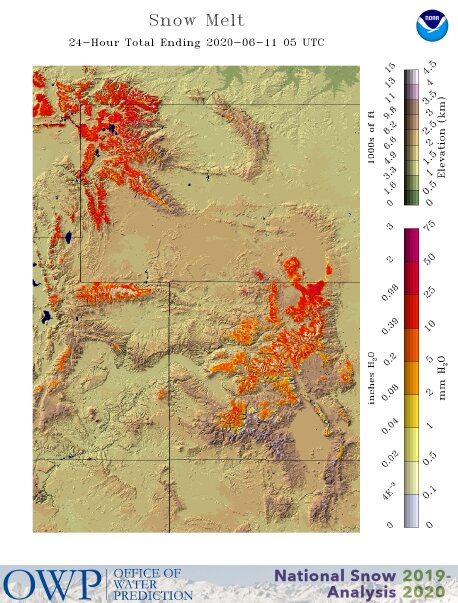
After a prolonged period of rather tumultuous weather across Colorado, Wednesday provided a bit of respite. Temperatures about 10F below normal were accompanied by partly cloudy skies with a gentle breeze. As shown below from the NOHRSC snow analysis, up to 1 inch of liquid melted off (or evaporated/sublimated away) on Wednesday over northern areas! This was mostly snow that accumulated during the recent precipitation event. Fortunately, there were no reports of flooding as rivers and creeks were running significantly below flood stage.
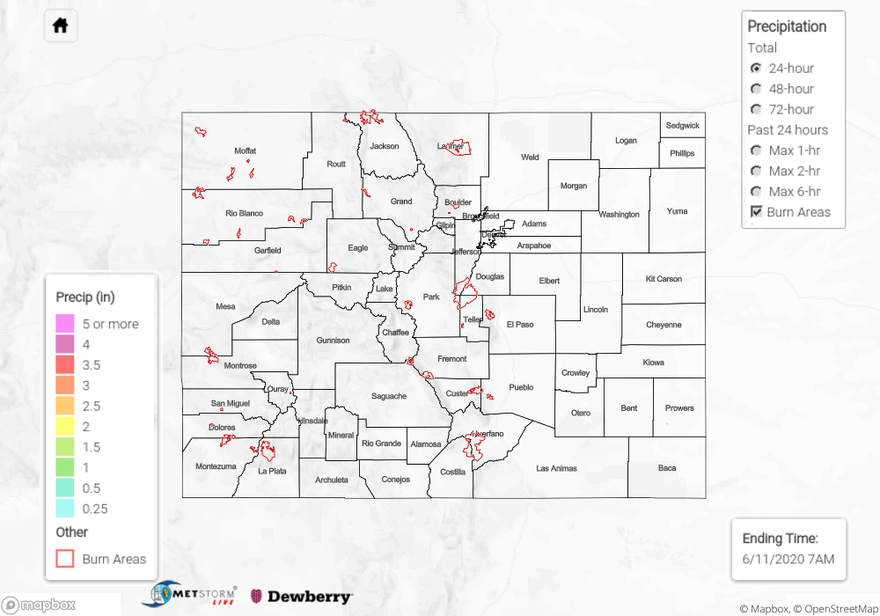
For precipitation estimates in your neighborhood over the last 72-hours, scroll down to the State Precipitation Map below.
Click Here For Map Overview
The map below shows radar-estimated, rainfall gage-adjusted Quantitative Precipitation Estimates (QPE) across Colorado. The map is updated daily during the operational season (May 1 – Sep 30) by 11AM. The following six layers are currently available: 24-hour, 48-hour and 72-hour total precipitation, as well as maximum 1-hour, 2-hour and 6-hour precipitation over the past 24 hour period (to estimate where flash flooding may have occurred). The 24-hour, 48-hour and 72-hour total precipitation contain bias corrections that are not disaggregated into the hourly estimates, so there will likely be some differences. The accumulation ending time is 7AM of the date shown in the bottom right corner. Also shown optionally are vulnerable fire burn areas (post 2012), which are updated throughout the season to include new, vulnerable burn areas. The home button in the top left corner resets the map to the original zoom.