SPM 06-17-2020: Another Day of Hot and Windy Conditions

Issue Date: Wednesday, June 17th, 2020
Issue Time: 9:10AM MDT

Summary:

Hot and windy conditions across the state really allowed the East Canyon fire to expand. Wind gusts were reported in the 45 to 55 mph range over western Colorado, with most of those reports from the Northwest Slope and Grand Valley. The fire grew from 895 acres to over 2,700 acres yesterday (as of 8PM)! As expected, there is lots of smoke in the area, and an Air Quality Alert was issued again today. Colorado Springs fire department posted a neat link that shows where all the smoke/haze over Colorado and your area is coming from Click Me. It was reported that Pikes Peak was barely visible this morning due to smoke in the area. To track all the large fire incidents yourself, visit the USDA Forest Service site here: https://fsapps.nwcg.gov/afm

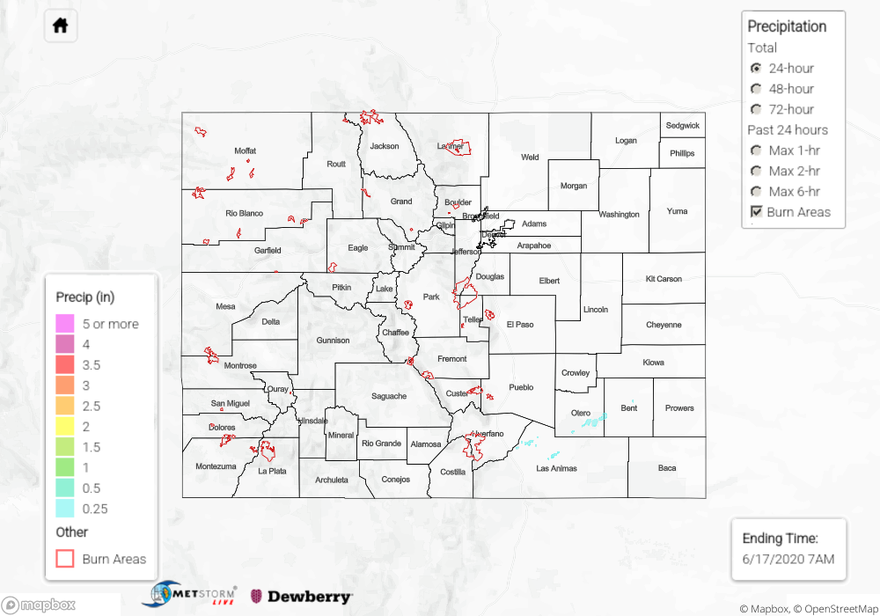
Highs yesterday afternoon reached 100F over the Southeast Plains, so slightly up from Tuesday. A couple high-based rain showers formed over the southern Southeast Mountains and Southeast Plains. Highest totals were around 0.25 inches, and likely overestimated due to the dry surface layer (evaporation). Flooding was not reported.

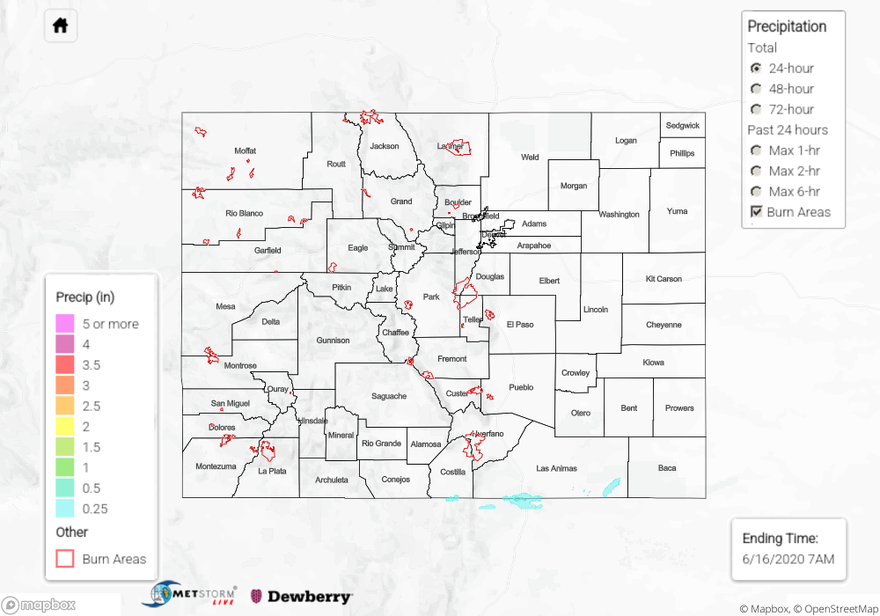
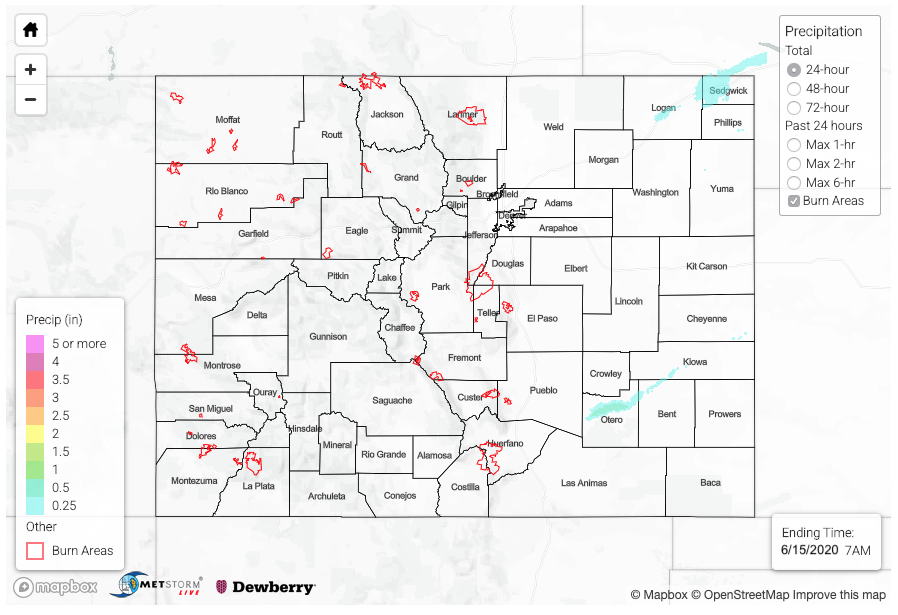
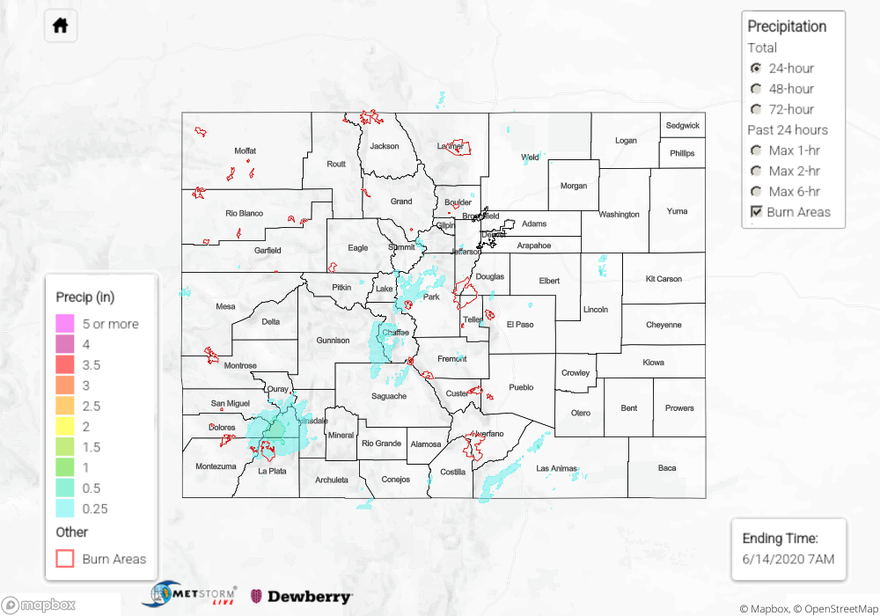
For precipitation estimates in your neighborhood over the last 24 to 72-hours, scroll down to the State Precipitation Map below.

Click Here For Map Overview

The map below shows radar-estimated, rainfall gage-adjusted Quantitative Precipitation Estimates (QPE) across Colorado. The map is updated daily during the operational season (May 1 – Sep 30) by 11AM. The following six layers are currently available: 24-hour, 48-hour and 72-hour total precipitation, as well as maximum 1-hour, 2-hour and 6-hour precipitation over the past 24 hour period (to estimate where flash flooding may have occurred). The 24-hour, 48-hour and 72-hour total precipitation contain bias corrections that are not disaggregated into the hourly estimates, so there will likely be some differences. The accumulation ending time is 7AM of the date shown in the bottom right corner. Also shown optionally are vulnerable fire burn areas (post 2012), which are updated throughout the season to include new, vulnerable burn areas. The home button in the top left corner resets the map to the original zoom.

SPM 06-16-2020: Hot with Isolated Storms Across Southeast

Issue Date: Tuesday, June 16th, 2020
Issue Time: 10AM MDT

Summary:

The scorching June heat continued across Colorado on Monday, with the following notable high temperatures: 101F at Lamar, 99F at Wray and 99F at Pueblo. Since June 1st, parts of eastern Colorado have averaged 6-10F above normal, with lower departures but still above average elsewhere across the state.

With enough boundary layer moisture, a few showers and storms formed mainly across the Sangre de Cristo mountains and moved eastward. With very low humidity below the cloud base, it was expectedly difficult to get rain to the ground. Nonetheless, radar estimates suggest up to 0.1 inch fell over lucky areas. An isolated storm southeast of Kim (Las Animas County) produced up to 0.5 inches per radar estimates, with a CoCoRaHS report of 0.33 inches. Flooding was not reported on Monday.

As expected, the higher elevation snowpack is close to being gone. However, the famous (to us, at least!) Tower SNOTEL site in the North Platte River valley is still measuring 10.1 inches of Snow Water Equivalent as of this morning. But interestingly, this is well below the normal value of 18.3 inches for the date.

For precipitation estimates in your neighborhood over the last 72-hours, scroll down to the State Precipitation Map below.

Click Here For Map Overview

The map below shows radar-estimated, rainfall gage-adjusted Quantitative Precipitation Estimates (QPE) across Colorado. The map is updated daily during the operational season (May 1 – Sep 30) by 11AM. The following six layers are currently available: 24-hour, 48-hour and 72-hour total precipitation, as well as maximum 1-hour, 2-hour and 6-hour precipitation over the past 24 hour period (to estimate where flash flooding may have occurred). The 24-hour, 48-hour and 72-hour total precipitation contain bias corrections that are not disaggregated into the hourly estimates, so there will likely be some differences. The accumulation ending time is 7AM of the date shown in the bottom right corner. Also shown optionally are vulnerable fire burn areas (post 2012), which are updated throughout the season to include new, vulnerable burn areas. The home button in the top left corner resets the map to the original zoom.

SPM 06-15-2020: New Fires Start in Areas Under Red Flag Warnings

Issue Date: Monday, June 15th, 2020
Issue Time: 9:35AM MDT

Summary:

High surface winds yesterday and a very dry air mass set the stage for rapid fire development. A couple grassland fires were started in Yuma County and near Brighton, CO. Additionally, a larger fire was sparked west of Durango on Menefee Mountain. The East Canyon fire grew from 40 acres to 895 acres since yesterday afternoon. An air quality advisory has been issued for La Plata, San Juan and eastern Dolores/Montezuma Counties today. Strong wind gusts helped fuel the fires with gusts in the area reported around 45 mph. Over the eastern plains, gusts reached between 65 and 70 mph!

On the precipitation front, a couple high-based showers developed over the west facing slopes of the Southeast Mountains. Totals were under 0.10 inches as moisture was scoured out west with the southwesterly flow aloft. As storms developed in low to moderate moisture over the eastern plains, totals just over 0.50 inches were estimated by radar over Otero County. Rocky Ford CoCoRaHS gages recorded totals just under 0.50 inches. Further north, a storm over Logan County produced just under a half inch of rainfall.

For precipitation estimates in your area over the last 24 to 72-hours, scroll down to the State Precipitation Map below. Please note there are some issues with Saturday’s QPE, so please ignore the values over northern Lincoln County and Alamosa County under the 72-hour rainfall totals.

Click Here For Map Overview

The map below shows radar-estimated, rainfall gage-adjusted Quantitative Precipitation Estimates (QPE) across Colorado. The map is updated daily during the operational season (May 1 – Sep 30) by 11AM. The following six layers are currently available: 24-hour, 48-hour and 72-hour total precipitation, as well as maximum 1-hour, 2-hour and 6-hour precipitation over the past 24 hour period (to estimate where flash flooding may have occurred). The 24-hour, 48-hour and 72-hour total precipitation contain bias corrections that are not disaggregated into the hourly estimates, so there will likely be some differences. The accumulation ending time is 7AM of the date shown in the bottom right corner. Also shown optionally are vulnerable fire burn areas (post 2012), which are updated throughout the season to include new, vulnerable burn areas. The home button in the top left corner resets the map to the original zoom.

SPM 06-14-2020: Scattered Storms Return to the Mountains

Issue Date: Sunday, June 14th, 2020
Issue Time: 9:20AM MDT

Summary:

Yesterday was the peak of this current event as dynamics and moisture combined to help return storms to the mountains and adjacent plains. There wasn’t a whole lot of moisture with this system, but trailing storms helped increase the storm totals in terms of precipitation. The most widespread rainfall, and highest 24-hour totals, were over the San Juan Mountains. A Low flood threat was issued for the 416 burn area, and there was a report of 0.18 inches in 10-minutes along with pea sized hail in Hesperus around 6PM. Radar estimates up to 0.50 inches of rain fell near the burn area, and observations in the area are as high as 0.75 inches (CoCoRaHS) for the 24-hour period. Thankfully, the more gradual rainfall allowed flooding issues to be avoided over the burn area. As storms moved into the adjacent plains and lower elevations, their rain rates tended to decrease and winds increase. However, a couple totals estimated by radar, neared 0.50 inches along the western Raton Ridge. Makes sense considering the moisture surge from the south. The afternoon cloud cover also felt nice as hot temperatures were present once again. There was also some wind reported yesterday with gusts reported in the 45 to 55 mph range over western Colorado and up to 67 mph over eastern Colorado (Cheraw). No damage was reported as of this morning.

For precipitation estimates in your area over the last 24 to 72-hours, scroll down to the State Precipitation Map below. Please note there are some issues with yesterday’s QPE, so please ignore the values over northern Lincoln County and Alamosa County under the 48-hour rainfall totals.

Click Here For Map Overview

The map below shows radar-estimated, rainfall gage-adjusted Quantitative Precipitation Estimates (QPE) across Colorado. The map is updated daily during the operational season (May 1 – Sep 30) by 11AM. The following six layers are currently available: 24-hour, 48-hour and 72-hour total precipitation, as well as maximum 1-hour, 2-hour and 6-hour precipitation over the past 24 hour period (to estimate where flash flooding may have occurred). The 24-hour, 48-hour and 72-hour total precipitation contain bias corrections that are not disaggregated into the hourly estimates, so there will likely be some differences. The accumulation ending time is 7AM of the date shown in the bottom right corner. Also shown optionally are vulnerable fire burn areas (post 2012), which are updated throughout the season to include new, vulnerable burn areas. The home button in the top left corner resets the map to the original zoom.