Issue Date: Wednesday, June 17th, 2020
Issue Time: 9:10AM MDT
Summary:
Hot and windy conditions across the state really allowed the East Canyon fire to expand. Wind gusts were reported in the 45 to 55 mph range over western Colorado, with most of those reports from the Northwest Slope and Grand Valley. The fire grew from 895 acres to over 2,700 acres yesterday (as of 8PM)! As expected, there is lots of smoke in the area, and an Air Quality Alert was issued again today. Colorado Springs fire department posted a neat link that shows where all the smoke/haze over Colorado and your area is coming from Click Me. It was reported that Pikes Peak was barely visible this morning due to smoke in the area. To track all the large fire incidents yourself, visit the USDA Forest Service site here: https://fsapps.nwcg.gov/afm
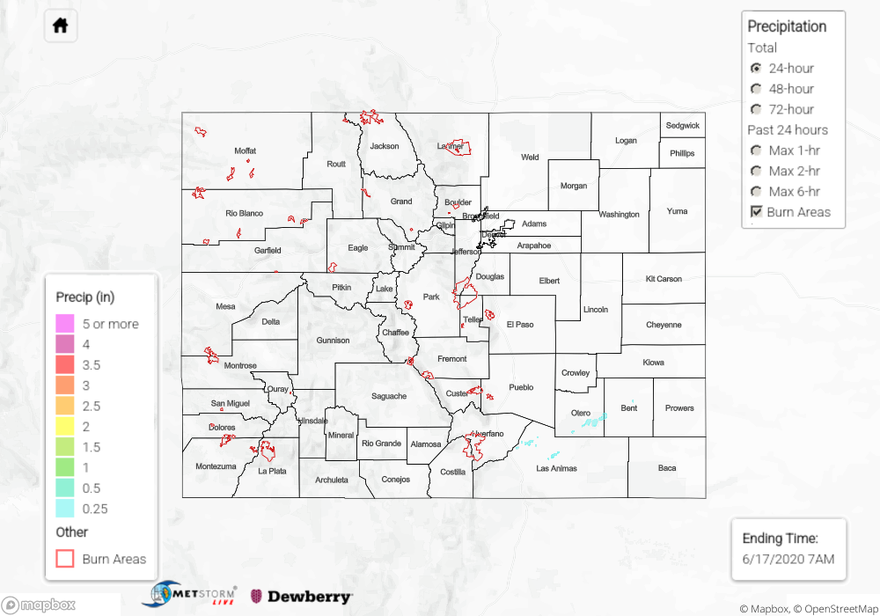
Highs yesterday afternoon reached 100F over the Southeast Plains, so slightly up from Tuesday. A couple high-based rain showers formed over the southern Southeast Mountains and Southeast Plains. Highest totals were around 0.25 inches, and likely overestimated due to the dry surface layer (evaporation). Flooding was not reported.
For precipitation estimates in your neighborhood over the last 24 to 72-hours, scroll down to the State Precipitation Map below.
Click Here For Map Overview
