Issue Date: Tuesday, June 16th, 2020
Issue Time: 10AM MDT
Summary:
The scorching June heat continued across Colorado on Monday, with the following notable high temperatures: 101F at Lamar, 99F at Wray and 99F at Pueblo. Since June 1st, parts of eastern Colorado have averaged 6-10F above normal, with lower departures but still above average elsewhere across the state.
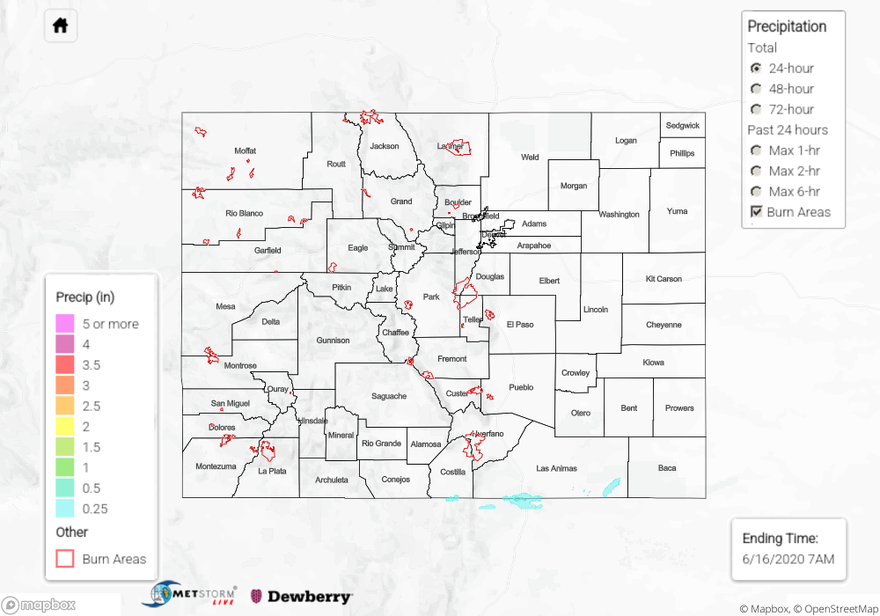
With enough boundary layer moisture, a few showers and storms formed mainly across the Sangre de Cristo mountains and moved eastward. With very low humidity below the cloud base, it was expectedly difficult to get rain to the ground. Nonetheless, radar estimates suggest up to 0.1 inch fell over lucky areas. An isolated storm southeast of Kim (Las Animas County) produced up to 0.5 inches per radar estimates, with a CoCoRaHS report of 0.33 inches. Flooding was not reported on Monday.
As expected, the higher elevation snowpack is close to being gone. However, the famous (to us, at least!) Tower SNOTEL site in the North Platte River valley is still measuring 10.1 inches of Snow Water Equivalent as of this morning. But interestingly, this is well below the normal value of 18.3 inches for the date.
For precipitation estimates in your neighborhood over the last 72-hours, scroll down to the State Precipitation Map below.
Click Here For Map Overview