Issue Date: Monday, June 15th, 2020
Issue Time: 9:35AM MDT
Summary:
High surface winds yesterday and a very dry air mass set the stage for rapid fire development. A couple grassland fires were started in Yuma County and near Brighton, CO. Additionally, a larger fire was sparked west of Durango on Menefee Mountain. The East Canyon fire grew from 40 acres to 895 acres since yesterday afternoon. An air quality advisory has been issued for La Plata, San Juan and eastern Dolores/Montezuma Counties today. Strong wind gusts helped fuel the fires with gusts in the area reported around 45 mph. Over the eastern plains, gusts reached between 65 and 70 mph!
On the precipitation front, a couple high-based showers developed over the west facing slopes of the Southeast Mountains. Totals were under 0.10 inches as moisture was scoured out west with the southwesterly flow aloft. As storms developed in low to moderate moisture over the eastern plains, totals just over 0.50 inches were estimated by radar over Otero County. Rocky Ford CoCoRaHS gages recorded totals just under 0.50 inches. Further north, a storm over Logan County produced just under a half inch of rainfall.
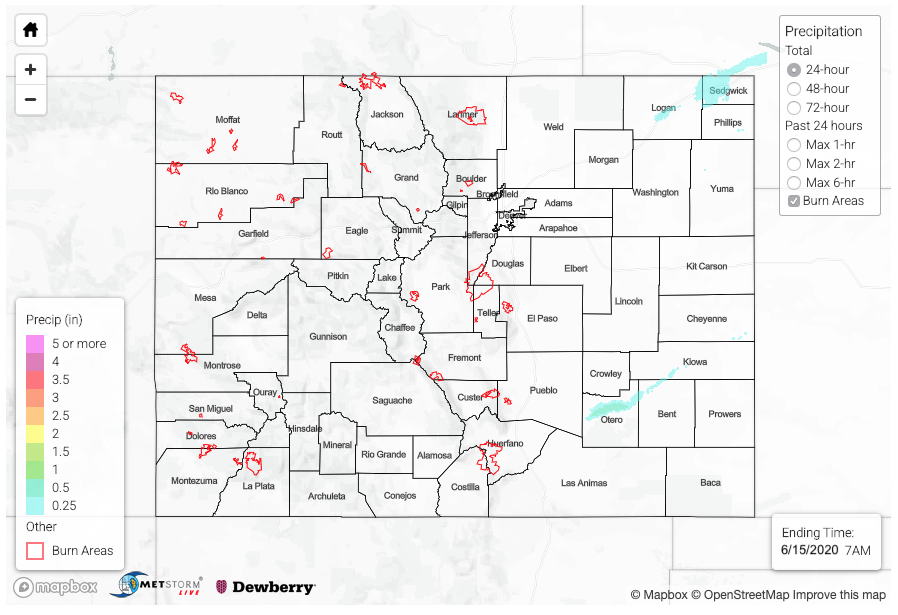
For precipitation estimates in your area over the last 24 to 72-hours, scroll down to the State Precipitation Map below. Please note there are some issues with Saturday’s QPE, so please ignore the values over northern Lincoln County and Alamosa County under the 72-hour rainfall totals.
Click Here For Map Overview
The map below shows radar-estimated, rainfall gage-adjusted Quantitative Precipitation Estimates (QPE) across Colorado. The map is updated daily during the operational season (May 1 – Sep 30) by 11AM. The following six layers are currently available: 24-hour, 48-hour and 72-hour total precipitation, as well as maximum 1-hour, 2-hour and 6-hour precipitation over the past 24 hour period (to estimate where flash flooding may have occurred). The 24-hour, 48-hour and 72-hour total precipitation contain bias corrections that are not disaggregated into the hourly estimates, so there will likely be some differences. The accumulation ending time is 7AM of the date shown in the bottom right corner. Also shown optionally are vulnerable fire burn areas (post 2012), which are updated throughout the season to include new, vulnerable burn areas. The home button in the top left corner resets the map to the original zoom.