SPM 07-07-2020: Downtick in Moisture Causes a Downturn in Afternoon Storm Activity

Issue Date: Tuesday, July 7th, 2020
Issue Time: 9:30AM MDT

Summary:

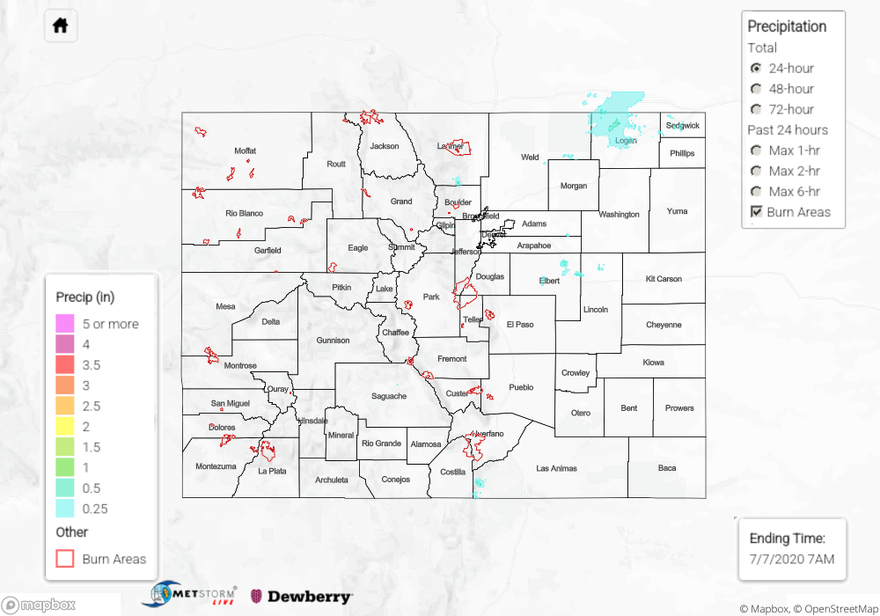
The heat started to crank up yesterday, and Grand Junction hit the 100F mark. DIA hit 97F just before 5PM. Some nice afternoon and evening cloud cover helped cool it off at the lucky locations. Storms yesterday were mostly high-based with limited moisture available, so they didn’t produce a lot of rainfall or large rain cores. The best rainfall coverage was over Logan County where just under a half inch fell. Storms looked more menacing on radar than they actually were. A CoCoRaHS gage north of Sterling recorded 0.40 inches of rainfall, which was the highest observation of the day. Another stronger storm formed over the Palmer Ridge and 0.36 inches of rain were recorded at a gage near Ramah in Elbert County. QPE estimated rain totals just over a half inch northwest and north of Limon. Back west, storms produced some gusty outflow winds over the Northern Mountains/Northwest Slope. A 50 mph gust was recorded in Craig with rainfall totals estimated below 0.05 inches in the area. Flooding was not reported.

For precipitation estimates in your neighborhood over the last 72-hours, scroll down to the State Precipitation Map below.

Click Here For Map Overview

The map below shows radar-estimated, rainfall gage-adjusted Quantitative Precipitation Estimates (QPE) across Colorado. The map is updated daily during the operational season (May 1 – Sep 30) by 11AM. The following six layers are currently available: 24-hour, 48-hour and 72-hour total precipitation, as well as maximum 1-hour, 2-hour and 6-hour precipitation over the past 24 hour period (to estimate where flash flooding may have occurred). The 24-hour, 48-hour and 72-hour total precipitation contain bias corrections that are not disaggregated into the hourly estimates, so there will likely be some differences. The accumulation ending time is 7AM of the date shown in the bottom right corner. Also shown optionally are vulnerable fire burn areas (post 2012), which are updated throughout the season to include new, vulnerable burn areas. The home button in the top left corner resets the map to the original zoom.

SPM 07-06-2020: Isolated Heavy Rainfall, But Lower Coverage on Sunday

Issue Date: Monday, July 6th, 2020
Issue Time: 9:15AM MDT

Summary:

With a gradual drying of the atmosphere, rainfall coverage and intensity took a step downward on Sunday. Nonetheless, scattered showers and thunderstorms were still abundant over certain regions like the Front Range, Central Mountains, San Juan Mountains and Southeast Mountains. Although storms were higher based, compared to Saturday, they were still able to deliver some short-term heavy rainfall. Amounts up to 0.40 inches, typically over a 10-15 minute period, were common mainly east of the Continental Divide. There were two areas that got more: first, a very isolated storms in Fremont County dropped just over 1.0 inch in less than 1 hour. A CoCoRaHS gage reported 1.07 inches this morning, which appears to be in the most intense part of the storm. Second, in Baca County, right along the Kansas border, a few slow moving cells dropped 1.0 to 1.5 inches of estimate rainfall. In both cases of the heavier rainfall, the areal coverage was too low to cause any flooding concerns.

In other news, the state enjoyed its last day of near normal temperatures on Sunday as a prolonged intense heat wave is expected to start today.

Flooding was not reported on Sunday. For precipitation estimates in your neighborhood over the last 24 to 72-hours, scroll down to the State Precipitation Map below.

Click Here For Map Overview

The map below shows radar-estimated, rainfall gage-adjusted Quantitative Precipitation Estimates (QPE) across Colorado. The map is updated daily during the operational season (May 1 – Sep 30) by 11AM. The following six layers are currently available: 24-hour, 48-hour and 72-hour total precipitation, as well as maximum 1-hour, 2-hour and 6-hour precipitation over the past 24 hour period (to estimate where flash flooding may have occurred). The 24-hour, 48-hour and 72-hour total precipitation contain bias corrections that are not disaggregated into the hourly estimates, so there will likely be some differences. The accumulation ending time is 7AM of the date shown in the bottom right corner. Also shown optionally are vulnerable fire burn areas (post 2012), which are updated throughout the season to include new, vulnerable burn areas. The home button in the top left corner resets the map to the original zoom.

SPM 07-05-2020: Beneficial Rainfall to Southeast Plains Drought Region

Issue Date: Sunday, July 5th, 2020
Issue Time: 10:10AM MDT

Summary:

The moisture plume had settled in over the state yesterday, and paired with some mid-level energy and slow steering flow, this set the stage for another day where storms could produce heavy rainfall. Action kicked off a little earlier over the mountains, which limited the amount of instability that could form. Therefore, rain rates were on the lower end. There were still some impressive totals for the pulsing storms, and SNOTEL sites recorded between 0.30 and 0.40 inches. A RAWS station near Vail recorded 0.50 inches, and another gage near Ruedi Reservoir recorded 0.56 inches. A Flash Flood Warning was issued for the Spring Creek burn area at 3:45PM and again at 5:30PM. QPE from the storms was estimated between 0.50 and 0.75 inches over the north portion of the burn area. The La Veta Pass NWS gage was located just to the south of the rainfall, so it wasn’t helpful in determining how much rain actually fell. RAWS gages just north of the burn area measured between 0.43 and 0.49 inches of rain. Flooding was not reported.

As storms moved off the mountains, they encountered better moisture and instability, which let them grow in coverage and strength. CoCoRaHS stations in Rocky Ford recorded just under 2 inches for the 24-hour period. MetStorm estimated 1-hour rain rates at 2 inches between Rocky Ford and La Junta. The La Junta NWS gage recorded 1.08 inches for the 24-hour period, so that core of 3.5 inches in the MetStorm QPE is likely high. My best guess is around 2 to 2.25 inches for the 24-hour period. There was flooding reported in La Junta with 2.5 to 3 feet of water flooding Highway 50 closing the road at the railroad overpass. The totals along the Kiowa and Bent County border is also likely high as CoCoRaHS in the area reported between 1.15 and 1.29 inches. Nonetheless, this was beneficial rainfall for an area experiencing a severe and worsening drought. Over the Metro area, there were a few ALERT gages just east of town (Aurora) that recorded between 1.18 and 1.65 inches of rain. There was a report of 3.13 inches from a spotter at Buckley Air Force Base, which I believe is high. The ASOS gage at Buckley recorded 1.46 inches, which is in line with 1.65 inches at the ALERT Sand Creek and Colfax gage. Flooding was not reported in this area despite a Flash Flood Warning being issued.

For precipitation estimates in your neighborhood over the last 24 to 72-hours, scroll down to the State Precipitation Map below. Note that Yuma and Kit Carson County 48 and 72-hour totals are likely inflated as I’ve shown QPE was likely overestimated the last couple of days compared to observations in the area.

Click Here For Map Overview

The map below shows radar-estimated, rainfall gage-adjusted Quantitative Precipitation Estimates (QPE) across Colorado. The map is updated daily during the operational season (May 1 – Sep 30) by 11AM. The following six layers are currently available: 24-hour, 48-hour and 72-hour total precipitation, as well as maximum 1-hour, 2-hour and 6-hour precipitation over the past 24 hour period (to estimate where flash flooding may have occurred). The 24-hour, 48-hour and 72-hour total precipitation contain bias corrections that are not disaggregated into the hourly estimates, so there will likely be some differences. The accumulation ending time is 7AM of the date shown in the bottom right corner. Also shown optionally are vulnerable fire burn areas (post 2012), which are updated throughout the season to include new, vulnerable burn areas. The home button in the top left corner resets the map to the original zoom.

SPM 07-04-2020: Heavy Rainfall Coverage Expands Across the Eastern Plains as Steering Flows Slow

Issue Date: Saturday, July 4th, 2020
Issue Time: 10:10AM MDT

Summary:

Higher dew points over the eastern plains yesterday help produce more widespread thunderstorm coverage. Storms had very slow steering winds, so they were able to produce extra rainfall over the areas they tracked across; especially east. Southwest Yuma County got hit again. The same WxUnderground gage from yesterday (south of Joes) showed 1.33 inches, whereas MetStorm had 1.50 inches. So, QPE estimations might be slightly overestimated again. If you’re keeping track, that’s a 48-hour total just over 2 inches for that station! Kit Carson County got hit again, and the coverage of wetting rain was greater than Thursday. There was a Flash Flood Warning issued for the thunderstorm complex just before 8PM as cars were hydroplaning off I-70. Gusts around 60 mph were also recorded with these storms, and hail up to 1.75 inches. There were a couple other Flash Flood Warnings over Yuma and Cheyenne County from NWS Goodland. No Flash Flood Warning was issued for Kiowa County despite storm totals being estimated at 3.50 inches. A WxUnderground station SE of Sheridan Lakes recorded 1.92 inches in the area of 3 to 3.50 inches in the QPE below, so totals were likely overestimated. Still, that’s quite a bit of rainfall!

Back west over the mountains, scattered totals were just under 0.50 inches with a lot of SNOTELS around 0.40 inches. There was a report of 0.54 inches of rain in Leadville for the 24-hour period. It was a bit too dry for much wetting rain in the western high county. More gusts than rainfall were reported with 45 mph gusts recorded over the Grand Valley. Outside of the hydroplaning, flooding was not reported as of this morning.

For precipitation estimates in your neighborhood over the last 24 to 72-hours, scroll down to the State Precipitation Map below. Note that the 72-hour QPE has some errors over the San Luis Valley. However, using the non-bias corrected QPE would really inflate totals from yesterday. Over Yuma and Kit Carson County, 48 and 72-hour totals are likely inflated as I’ve shown QPE was likely overestimated the last couple of days compared to observations in the area.

Click Here For Map Overview

The map below shows radar-estimated, rainfall gage-adjusted Quantitative Precipitation Estimates (QPE) across Colorado. The map is updated daily during the operational season (May 1 – Sep 30) by 11AM. The following six layers are currently available: 24-hour, 48-hour and 72-hour total precipitation, as well as maximum 1-hour, 2-hour and 6-hour precipitation over the past 24 hour period (to estimate where flash flooding may have occurred). The 24-hour, 48-hour and 72-hour total precipitation contain bias corrections that are not disaggregated into the hourly estimates, so there will likely be some differences. The accumulation ending time is 7AM of the date shown in the bottom right corner. Also shown optionally are vulnerable fire burn areas (post 2012), which are updated throughout the season to include new, vulnerable burn areas. The home button in the top left corner resets the map to the original zoom.